TAKEAWAYS
- Fed raised interest rates 25 basis points but didn't indicate if this would be the last rate hike
- The Dow Jones Industrial Average came off its high but managed to close higher for its 13-day win streak
- There wasn't much reaction in the gold market after the Fed's decision
The Fed raised interest rates by 25 basis points—no surprise there. The stock market has priced in a 25-basis point rate hike, which will bring interest rates to the 5.25% to 5.5% range. That's the highest the Fed funds rate has been in 22 years. Should we expect more rate hikes this year?
If you remember, in the last meeting, the Fed left rates steady, but indicated that we could expect two more 25-basis point increases in 2023. When Fed Chairman Jerome Powell takes the podium, investors will be listening for hints of whether there'll be one more rate hike or if this will be it.
Alas, Chairman Powell's language was similar to what he said in the last meeting. Even though inflation is cooling, it's still above the 2% target. The US economy is growing at a modest pace, and the labor market remains very tight. For inflation to move lower, it could require below-trend growth and a softening of the labor market.
Powell mentioned that the Fed will take a data-dependent approach and continue to make decisions meeting by meeting. It'll take time to see the full effects of the Fed's monetary policy decisions, especially when it comes to inflation. When asked about when the Fed will stop raising rates, Powell responded by saying that they'll stop raising rates when they're comfortable with it.
Powell also doesn't foresee a recession in the near future, but this view is far from being assured. There are still many uncertainties. He also doesn't believe that many job losses are necessary for prices to fall to the Fed's 2% target.
Is Inflation Cooling?
We have started to see signs of inflation cooling—CPI up 3% year-over-year and core CPI up 4.8% year-over-year—which is encouraging. But one month's data doesn't set a trend. Remember, energy prices fell over 16% on an annual basis. Compare that to the 5.7% rise in food prices over the last 12 months.
Energy makes up a significant portion of household expenses and, with energy prices coming off their lows (see chart of Energy Select Sector SPDR ETF, XLE, below), it remains to be seen if the cooling inflation was a one-off.
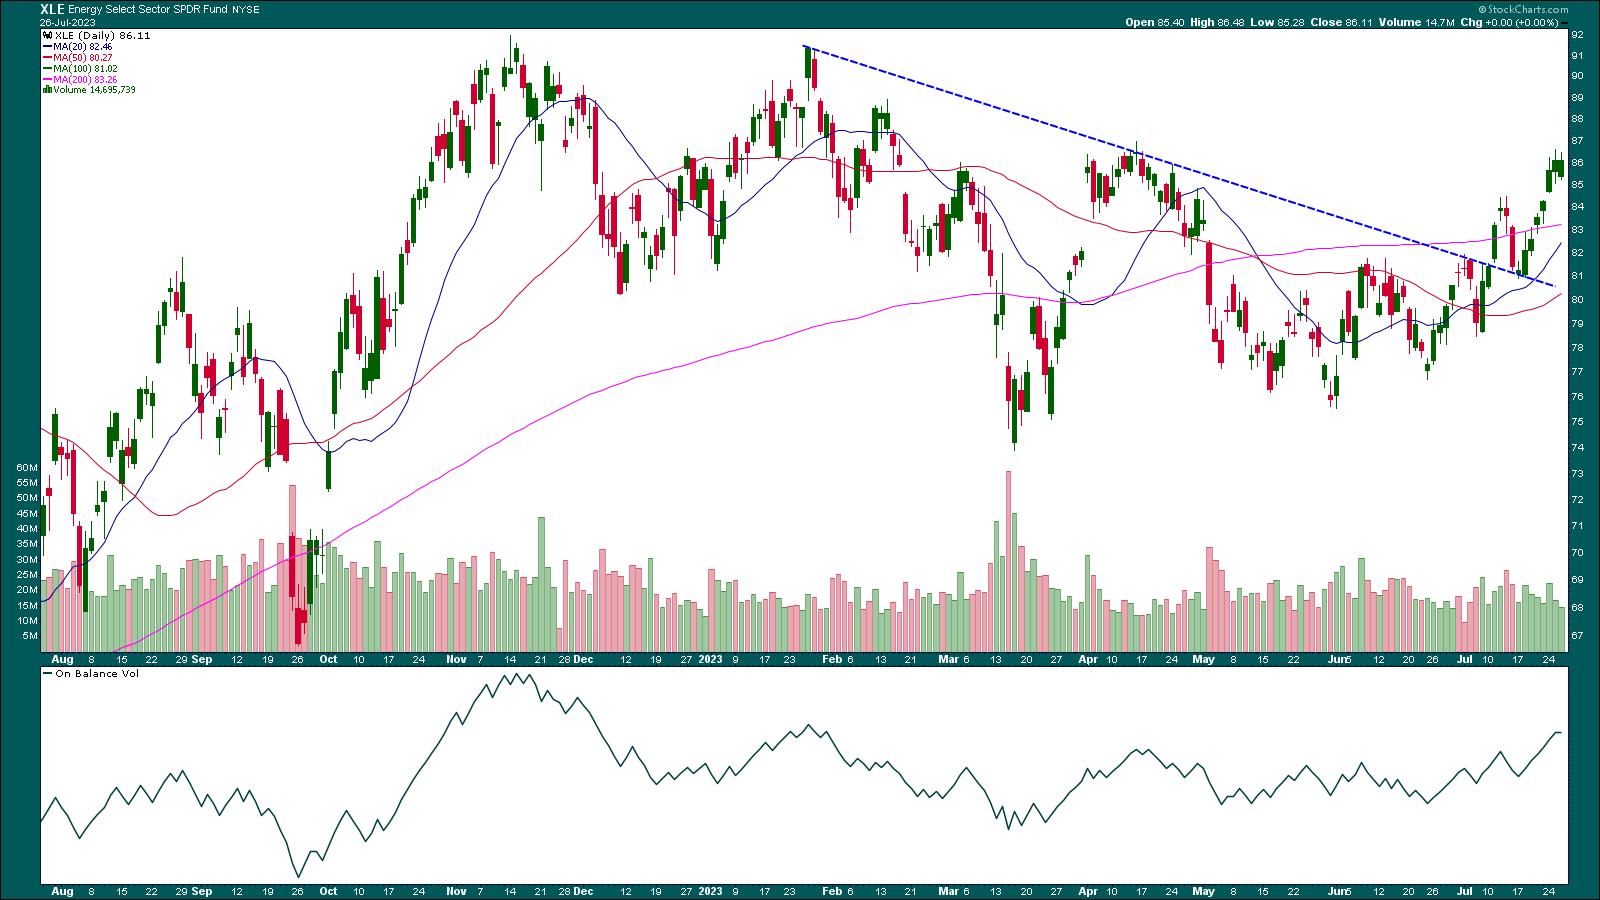
CHART 1: ENERGY SELECT SECTOR SPDR ETF (XLE) CONTINUES TO RISE. Keep an eye on XLE since its price action could impact inflation data in the next few months.Chart source: StockCharts.com (click on chart for live version). For educational purposes.XLE has broken above a downward-sloping trendline and is trading above its 200-day simple moving average. The On Balance Volume (OBV) indicator in the lower panel is trending higher, which means volume on up days is greater than volume on down days. As long as the uptrend is supported, it's safe to assume that energy prices will rise.

The Big-Picture View
While the general feeling is that the US will avoid a recession, there are a few areas that investors should watch—home prices, consumer confidence, and the labor market.
- Home prices in May were lower than a year ago, according to S&P CoreLogic Case Shiller Indices data, but stronger than expected.
- Consumer confidence increased to 117 in July, the highest level in two years.
- The labor market hasn't shown signs of cooling. Wage growth has been fast—hourly earnings in June rose 4.4% annually.
The core Personal Expenditures (PCE) Price index for June will be released on Friday. The Fed watches the PCE closely, and, in May, it rose 4.6%, which is still a ways away from 2%. For as long as supply and demand in the labor market are not in balance, inflation is likely to remain above the Fed's 2% target.
The stock and bond markets didn't react much following the Fed's rate decision. However, after Powell's presser, the Dow Jones Industrial Average ($INDU) climbed higher, pulled back, and managed to clinch its 13-day winning streak, something it hasn't done since 1987.
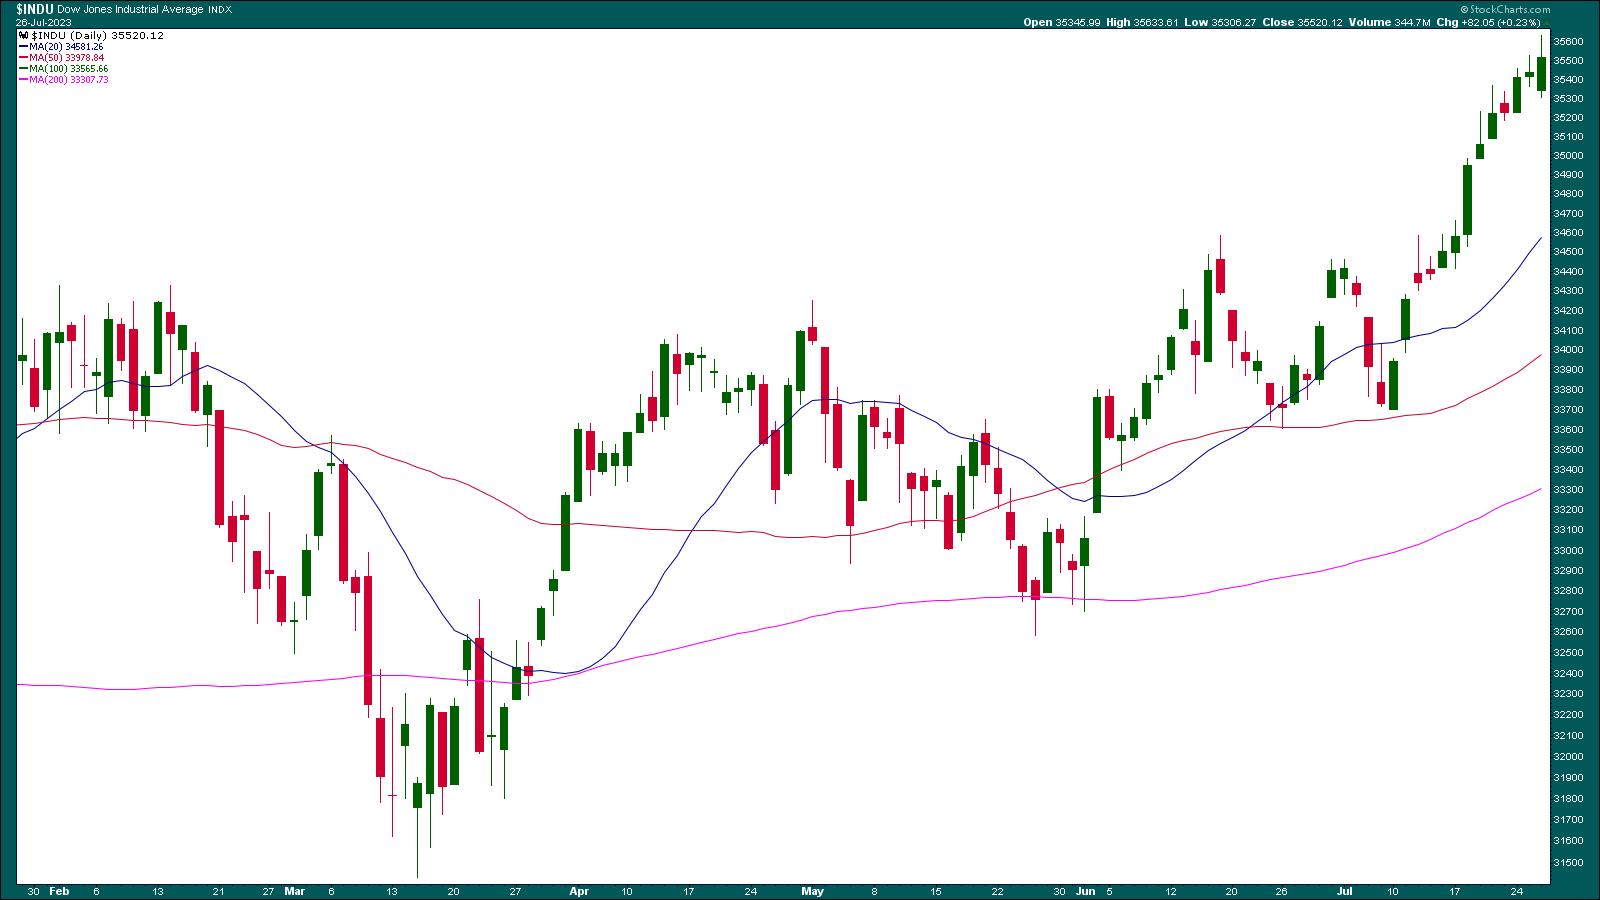
CHART 2: 13-DAY WINNING STREAK FOR THE DOW JONES INDUSTRIAL AVERAGE. After Powell's speech $INDU spiked briefly but pulled back. However, it managed to close higher and maintain its winning streak.Chart source: StockCharts.com (click on chart for live version). For educational purposes.
And How Are the Gold Bulls Responding?
Recently, there have been two things supporting bullish gold sentiment:
- First, the hope that the Fed's tightening cycle will finally come to an end; and
- Second, that the threat of an impending recession still hangs in the air.
JPMorgan Chase (JPM) shares this view. It predicts the Fed will lower interest rates by Q2 2024, which would result in lower real US yields and higher gold prices.
The bank sees COMEX gold ($GOLD) hovering around $2,012 an ounce by the second half of this year (currently 2% above current prices) and, should the US economy fall into a recession, around $2,175 by the end of 2024 (10% above current prices).
For SPDR Gold Trust ETF (GLD), that translates to a price target of $201 by the end of 2024.
Other hedge funds and institutions seemed to have jumped onto this golden bandwagon as well. The most recent Commitments of Traders report from the CFTC tells us that money managers made more bets that gold (futures) would go up. The gold futures market now has 115,318 more long contracts than short ones, meaning that the overall market mood has been the most bullish it's been since early March 2022.
Gold ($GOLD) and GLD has been on a four-week uptrend, but the near-term fate of gold prices depends on how closely Fed Chair Jerome Powell's guidance matches gold bull expectations. The 25-basis point rate hike didn't get much reaction from the gold market, as Powell's "data-dependent" spiel kept gold bulls and bears in a holding pattern.

CHART 3: WHAT'S A POTENTIAL PRICE TARGET FOR GLD? The upside targets for GLD are displayed in blue, and the green line represents the JPM 2024 target-equivalent. The red dashed lines represent bearish targets.
Chart source: StockChartsACP. For educational purposes.
- On the technical front, the bulls still hold the advantage. Their objective is to push gold prices above the near-term and historical resistance between $191.00 and $193.00 (see blue dotted lines). The equivalent to the JPMorgan Chase COMEX gold ($GOLD) target is represented by the green dotted line at $201.00.
- On the downside, bears' objective would be to see GLD prices decline to support near $175.00 and $168.00, as shown in the chart (see red dotted lines).
Similar to the Fed itself, gold bulls and bears will have to monitor the forthcoming inflation and labor market reports to adjust their positions accordingly. Onerous, possibly, but necessary, yes (that is, if you want to stay at the edge of the curve).
The Bottom Line
The next Fed meeting is in September. There are still two CPI and PPI (in addition to several labor market) reports ahead of the next FOMC meeting. And, as Powell reiterated, the full impact of the Fed's rate hikes has not yet been felt in the economy, as it usually takes six months to a year for a rate hike to have a full effect. Till then, it's best to take a day-to-day approach.
Disclaimer: This blog is for educational purposes only and should not be construed as financial advice. The ideas and strategies should never be used without first assessing your own personal and financial situation, or without consulting a financial professional.
Happy charting!
Happy charting!


