TAKEAWAYS
- The stock market indices closed higher for the day but ended the week lower
- The 10-year Treasury yield closed higher at 4.04%
- In spite of the pullback in equities, the stock market indices are still looking technically strong
You can't blame the market for taking a breather after nine positive weeks.
The first trading week in January ended lower, which may have concerned investors. It's understandable how jittery investors are when you view the market's reaction to the December jobs report. The jobs data came in better than expected, which sent ripples through Wall Street. Right after the data was reported, equity futures fell, and Treasury yields ticked higher.
However, investors overcame the shock after digesting the info and looking more closely at the data. And the lower-than-expected ISM number, plus factoring in two major strikes and their impact on the jobs numbers, calmed investors for a short while. Equities turned higher, and Treasury yields dropped. The market continued to seesaw between gains and losses throughout the trading day.
Don't be surprised if the market exhibits similar behavior next week, as investors await December CPI data and the start of earnings season. This doesn't happen till the end of the week, so expect more of the same until Thursday.
According to the CME FedWatch Tool, the probability of an interest rate cut in the March Fed meeting is at 64%, lower than before today's data was released. 2024 is a 50-50 year, with elections and the Fed's interest rate. Elections are going to take place in several countries around the world. And with over half the world's population heading to the polls this year, it's bound to bring some volatility to the stock market.
From a seasonal perspective for the US market, the first quarter of an election year tends to be volatile. There's a chance that stocks could sell off ahead of the elections, but generally trend higher after the elections. And while 2023 performed as expected, seasonally, it doesn't mean you should sit back and expect your portfolio to grow at the end of the year. Keep a watch on the broader market.
Given the S&P 500 index ($SPX) has been trending higher, trading above its 50-month simple moving average and showing a relatively steep uptrend since 2022 (see chart below), a correction shouldn't be worrisome until the index nosedives below critical support levels.
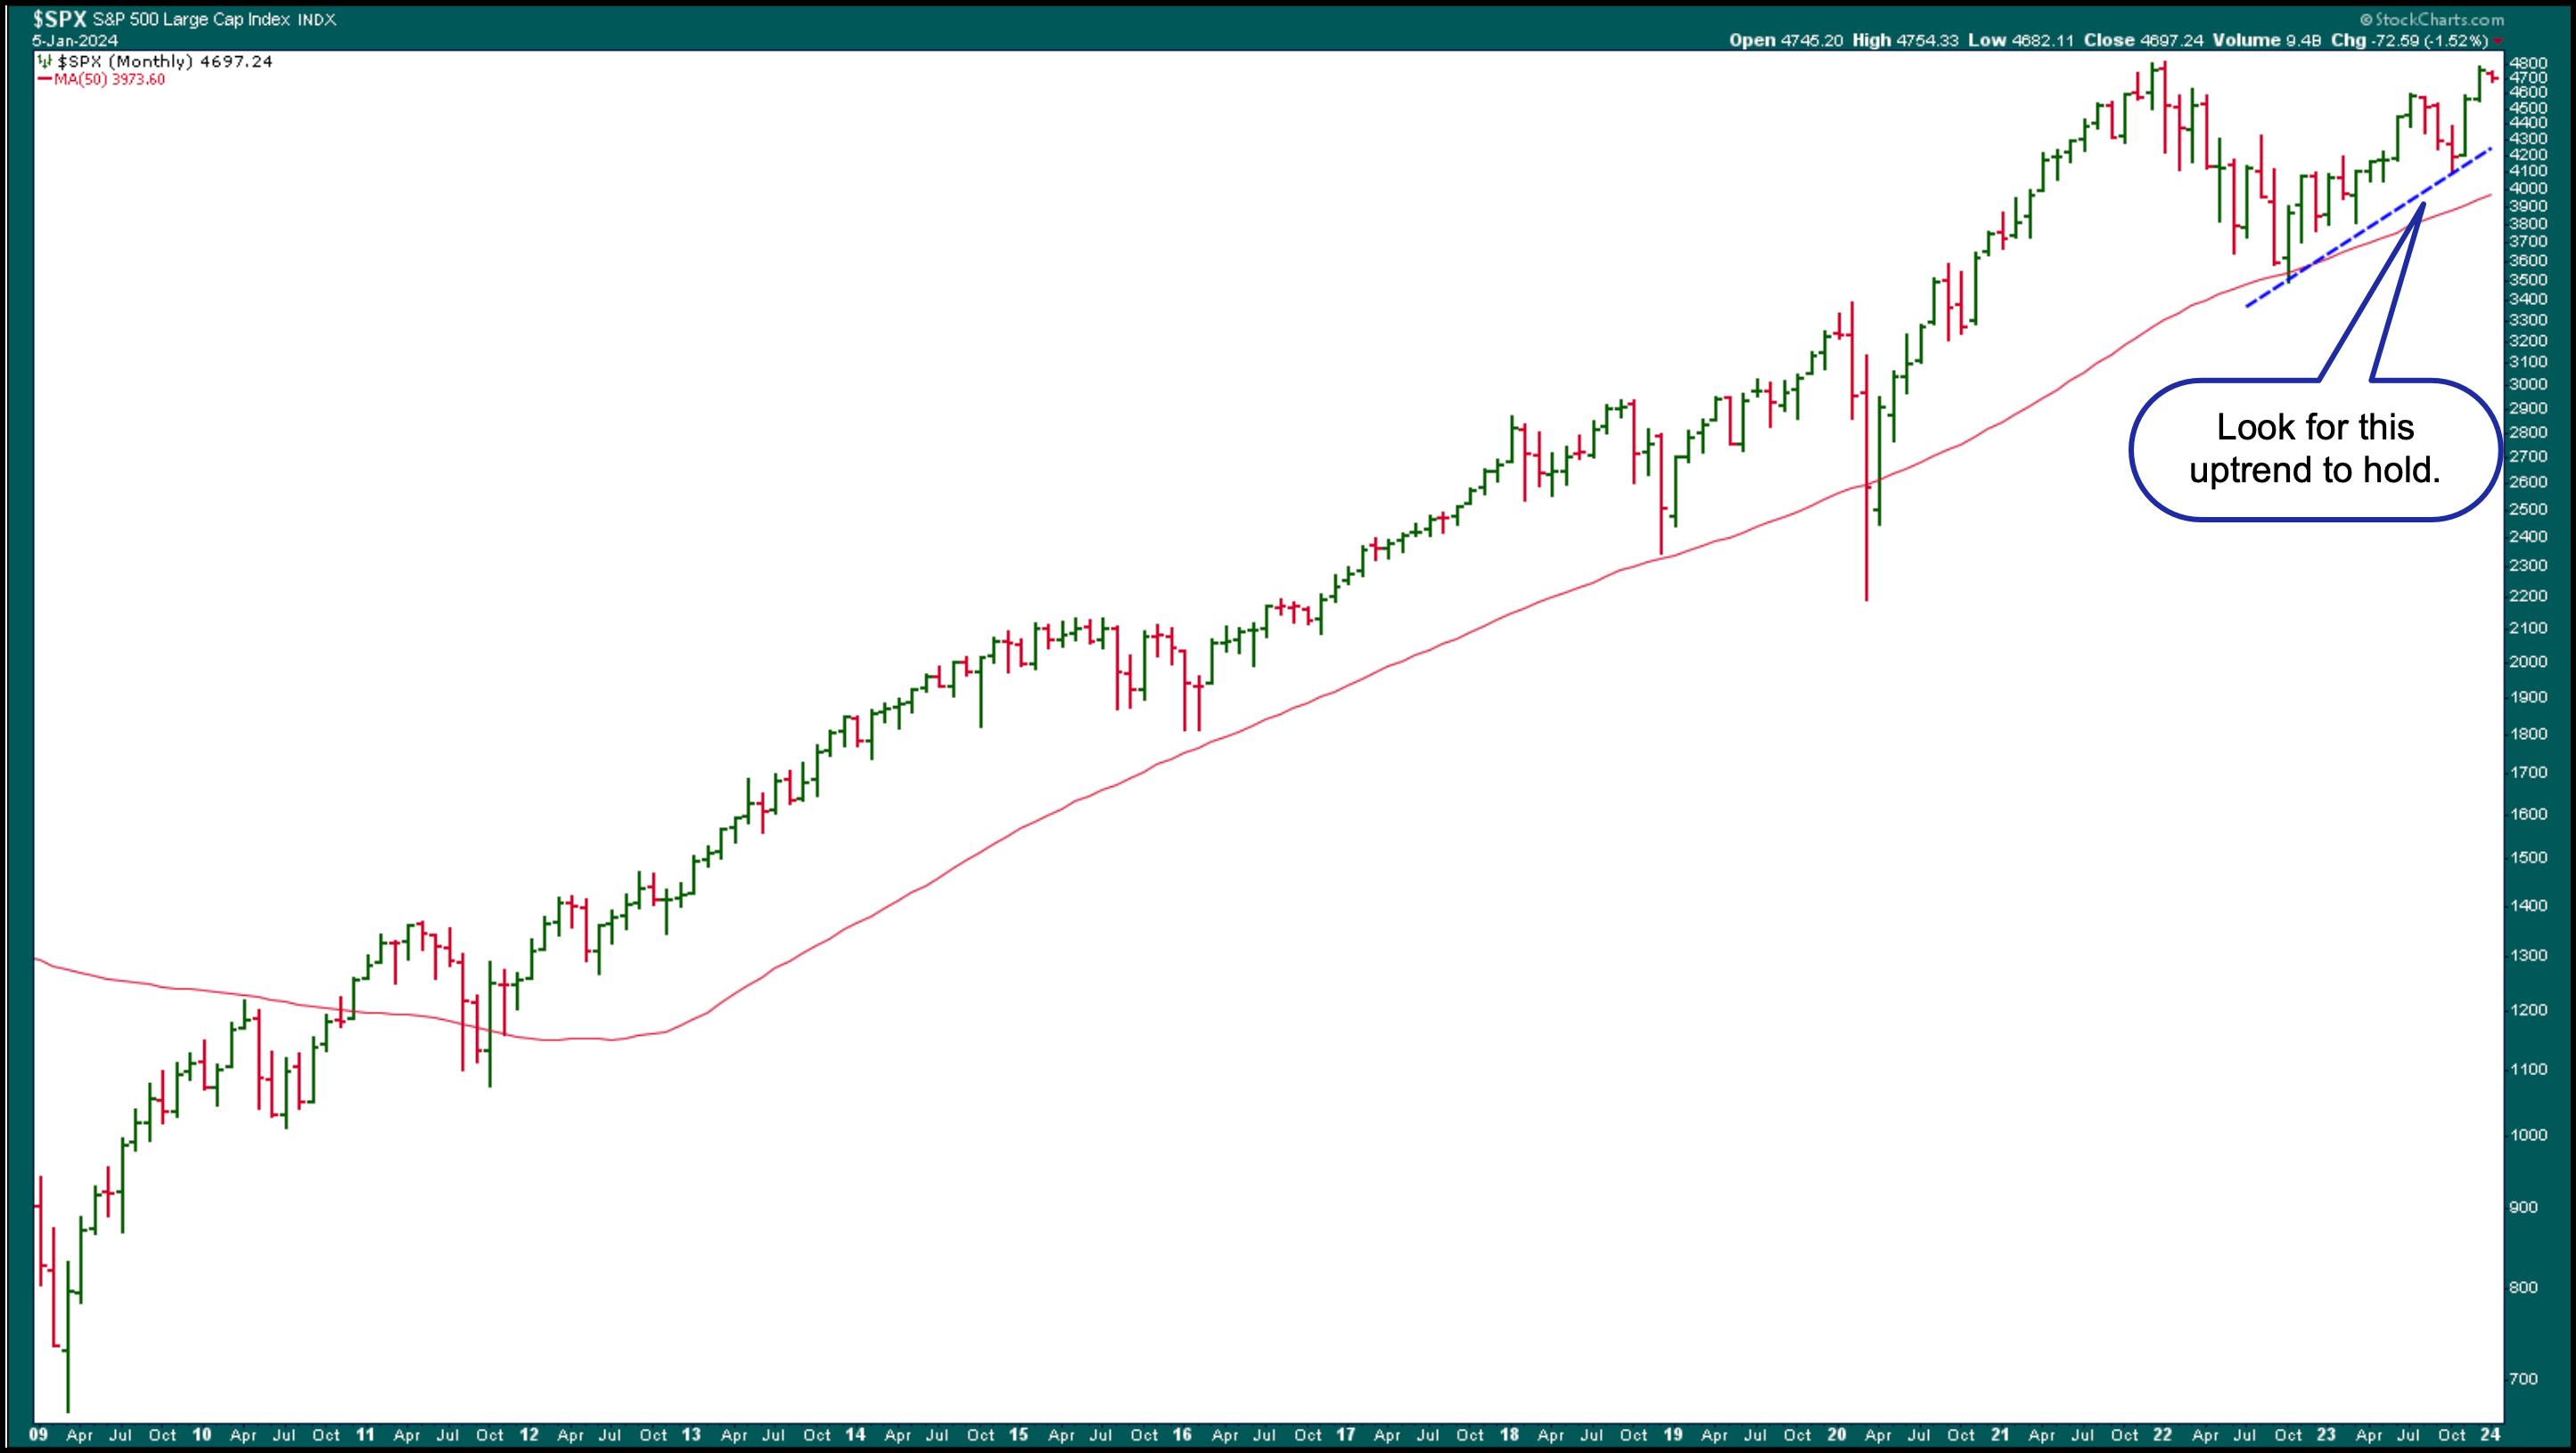
CHART 1. MONTHLY CHART OF S&P 500. The index has been trending higher since 2012 and, except for a few instances, staying above its 50-month simple moving average. A break below the blue dashed uptrend line could be the first indication of a reversal.Chart source: StockCharts.com. For educational purposes.
We have seen a rotation in leadership from Technology to Financials and Health Care, two sectors that struggled last year. The hope of lower interest rates likely boosted the Financials, which have seen a sharp upside rally since early November. The Health Care sector saw a similar move as Financials, though it pulled back a bit on Friday.
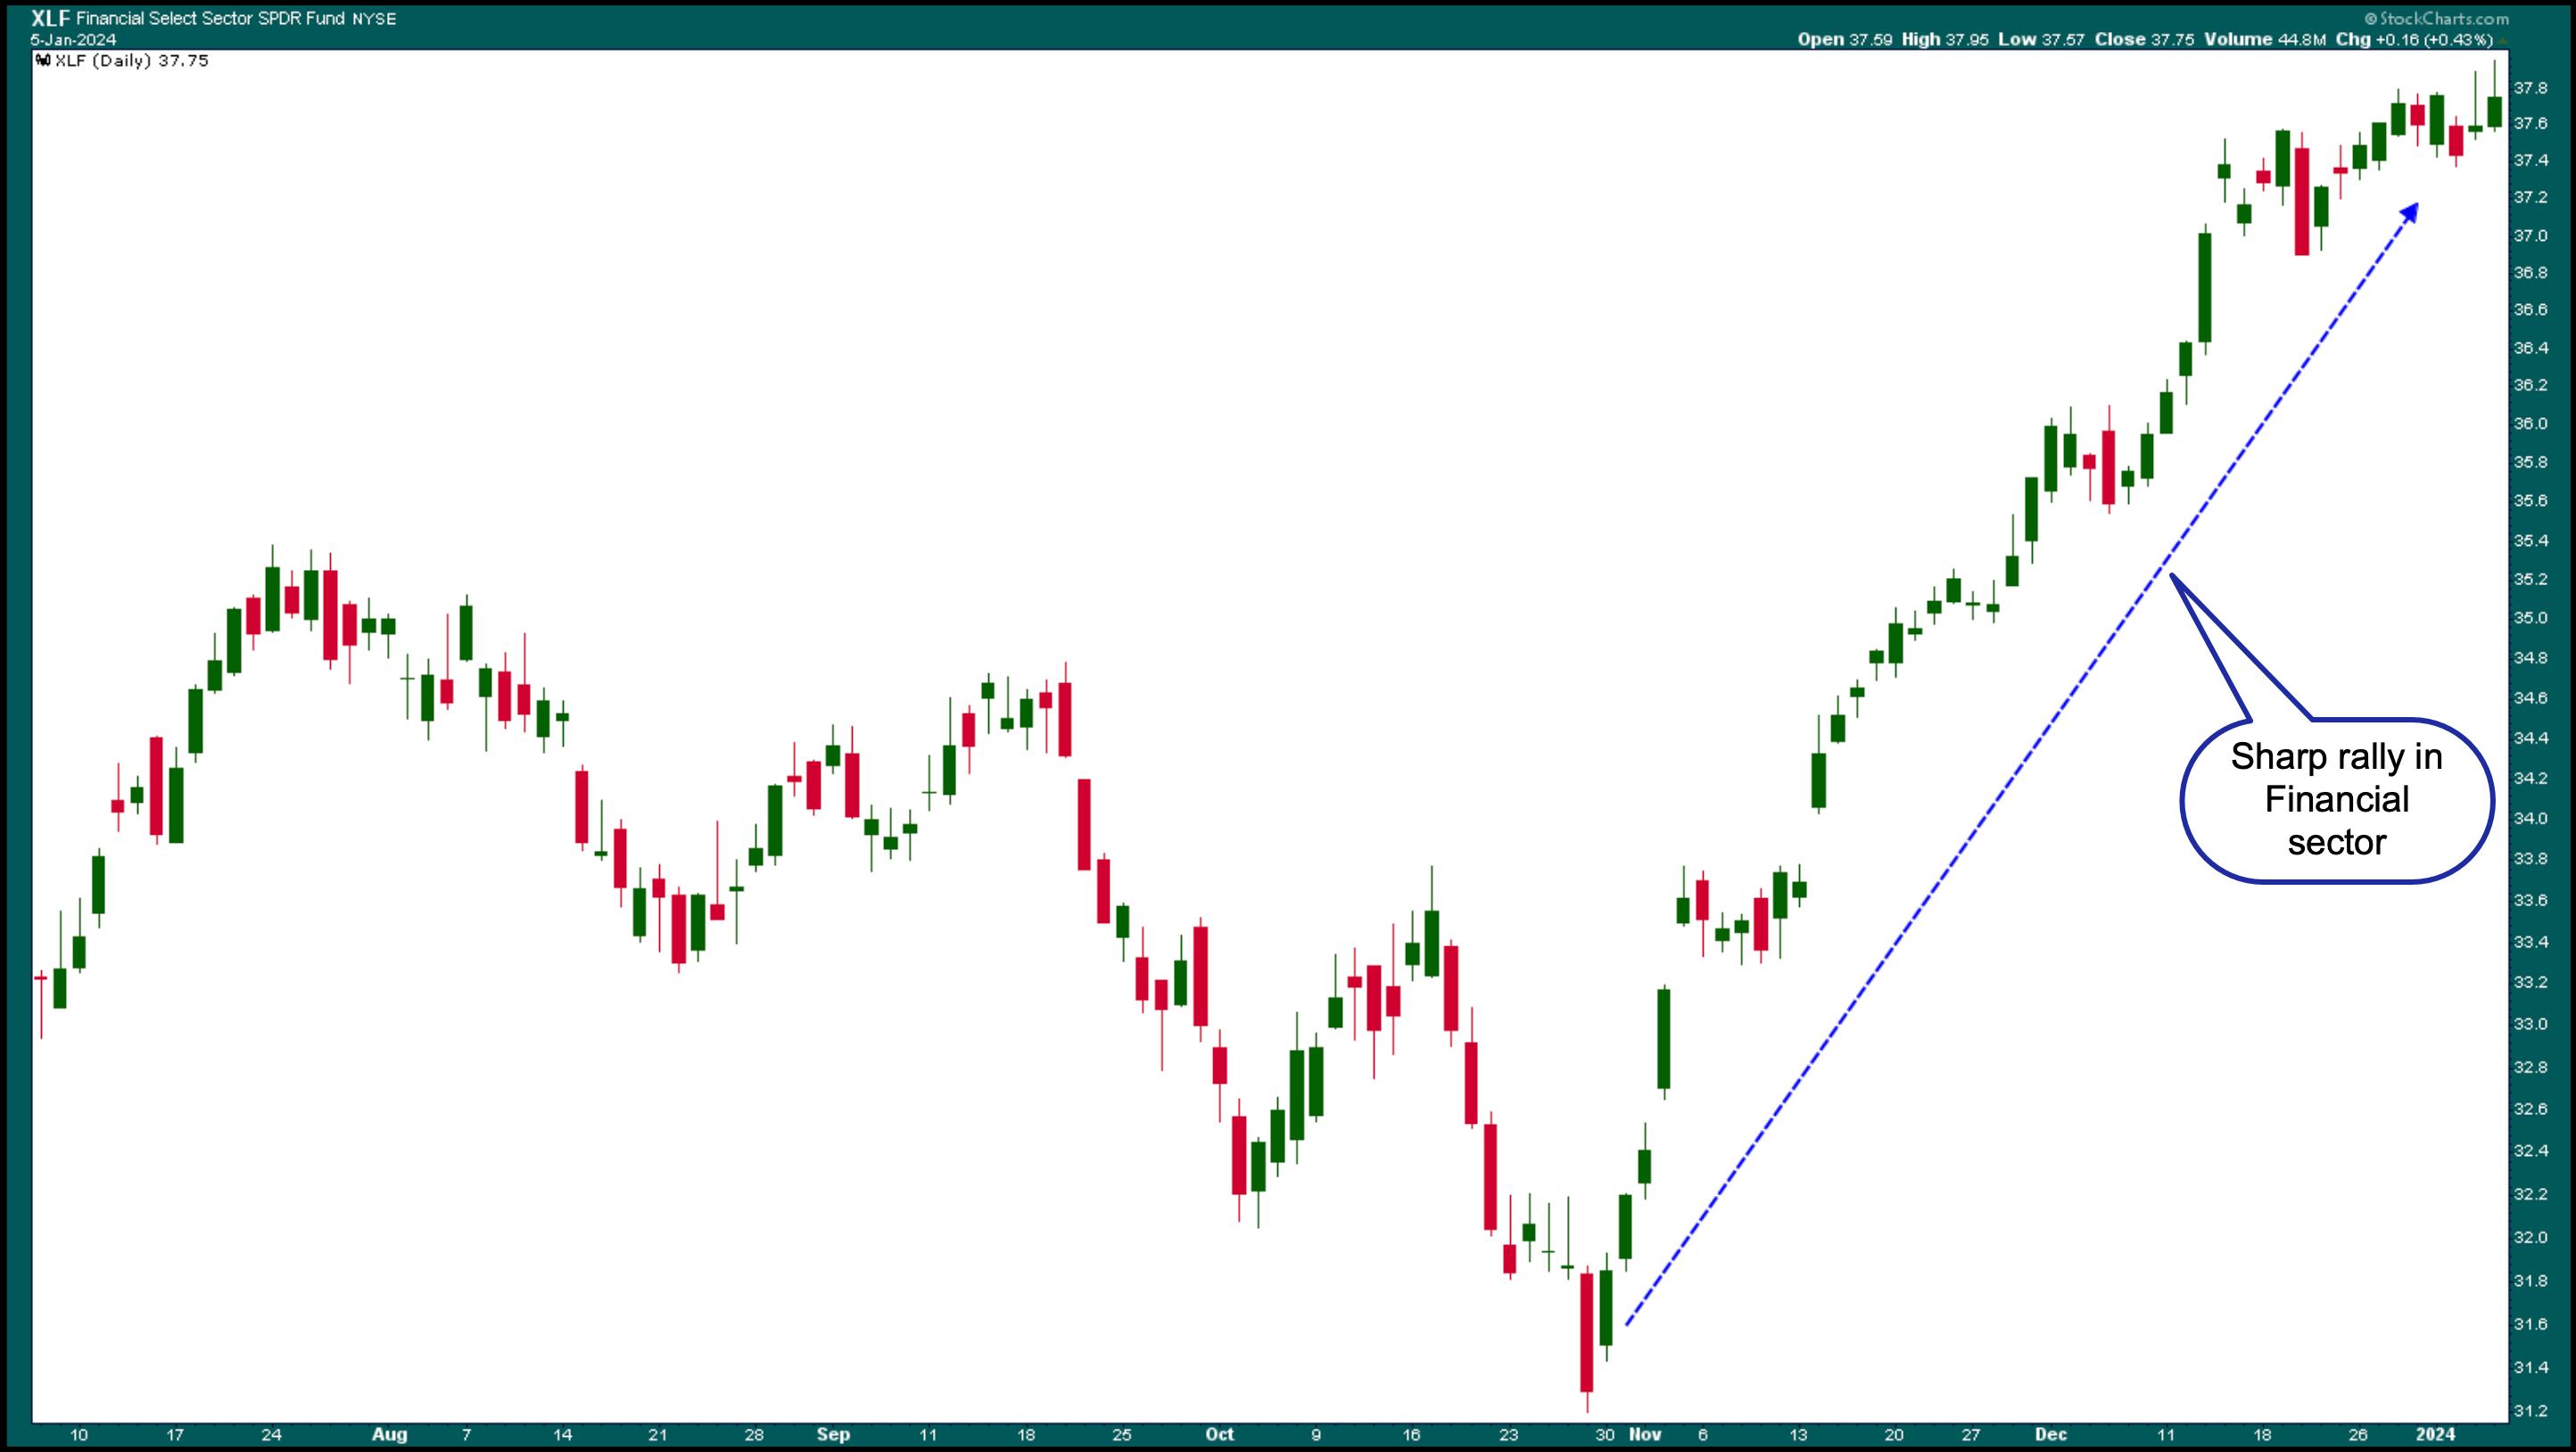
CHART 2. DAILY CHART OF FINANCIAL SELECT SECTOR SPDR ETF (XLF). After yields started falling, the Financials started recovering and rallied strongly.Chart source: StockCharts.com. For educational purposes.
But that doesn't mean the Magnificent Seven will lose their status symbol. Although it closed off its high, Nvidia Corp. (NVDA) showed signs of recovering today. NVDA's stock still has a strong chart, maintaining support of its 50-day SMA. If the stock continues to rally in 2024, it could pull the rest of the market with it, especially the other six stocks that closely follow behind. So don't lose faith in the mega-cap tech stocks just yet.
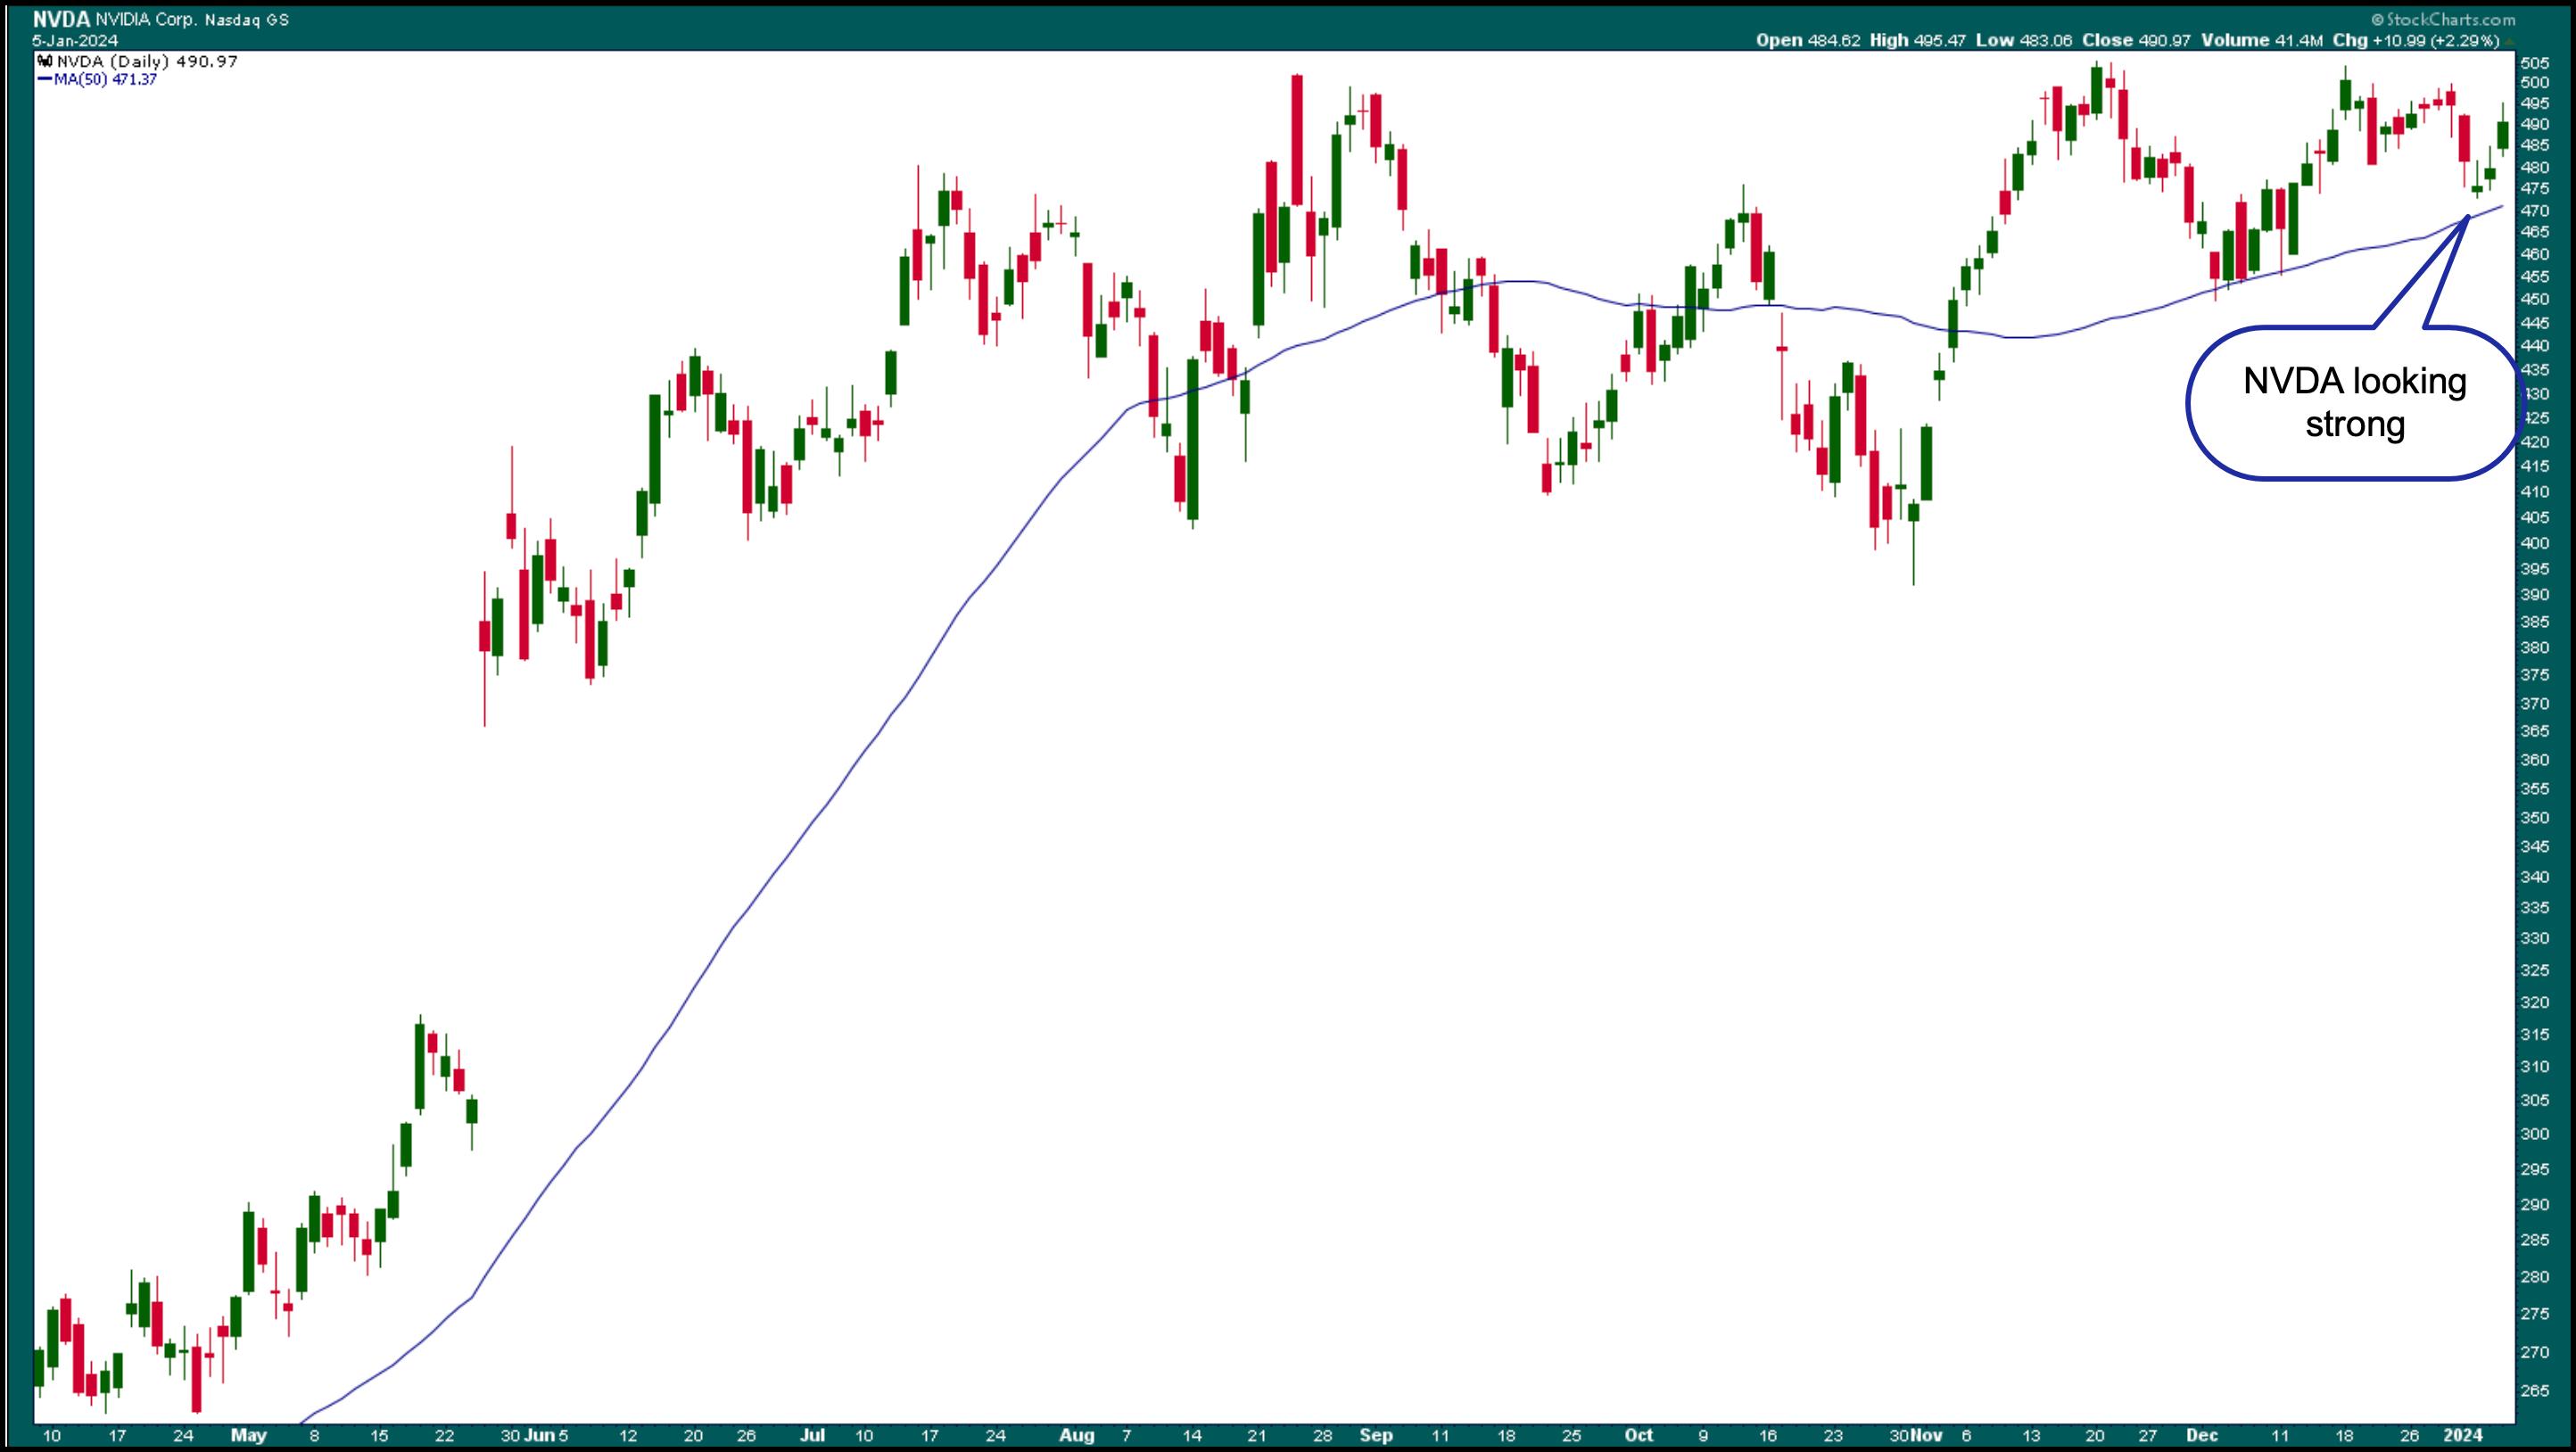
CHART 3. NVIDIA STOCK IS STILL BULLISH. Don't give up on the Magnificent Seven stocks; they could still rally higher.Chart source: StockCharts.com. For educational purposes.
It's not out of reach for Treasury yields to fall lower, as the Fed is expected to lower rates. Lower interest rates could see growth stocks pull back, but how much lower are interest rates likely to go?
As long as the economy keeps chugging along, the expectations the market has priced in will probably hold. But that doesn't mean interest rates will fall close to zero; more likely, they will pull back, and then probably settle at around the 3% level. A lot has to do with the balance between interest rates and economic growth.
On a closing note, small-cap stocks could show strength as rates fall. Keep an eye on a chart of the small caps vs. large caps in 2024, such as the one below of iShares Russell 2000 ETF vs. the SPDR S&P 500 ETF (IWM:SPY).
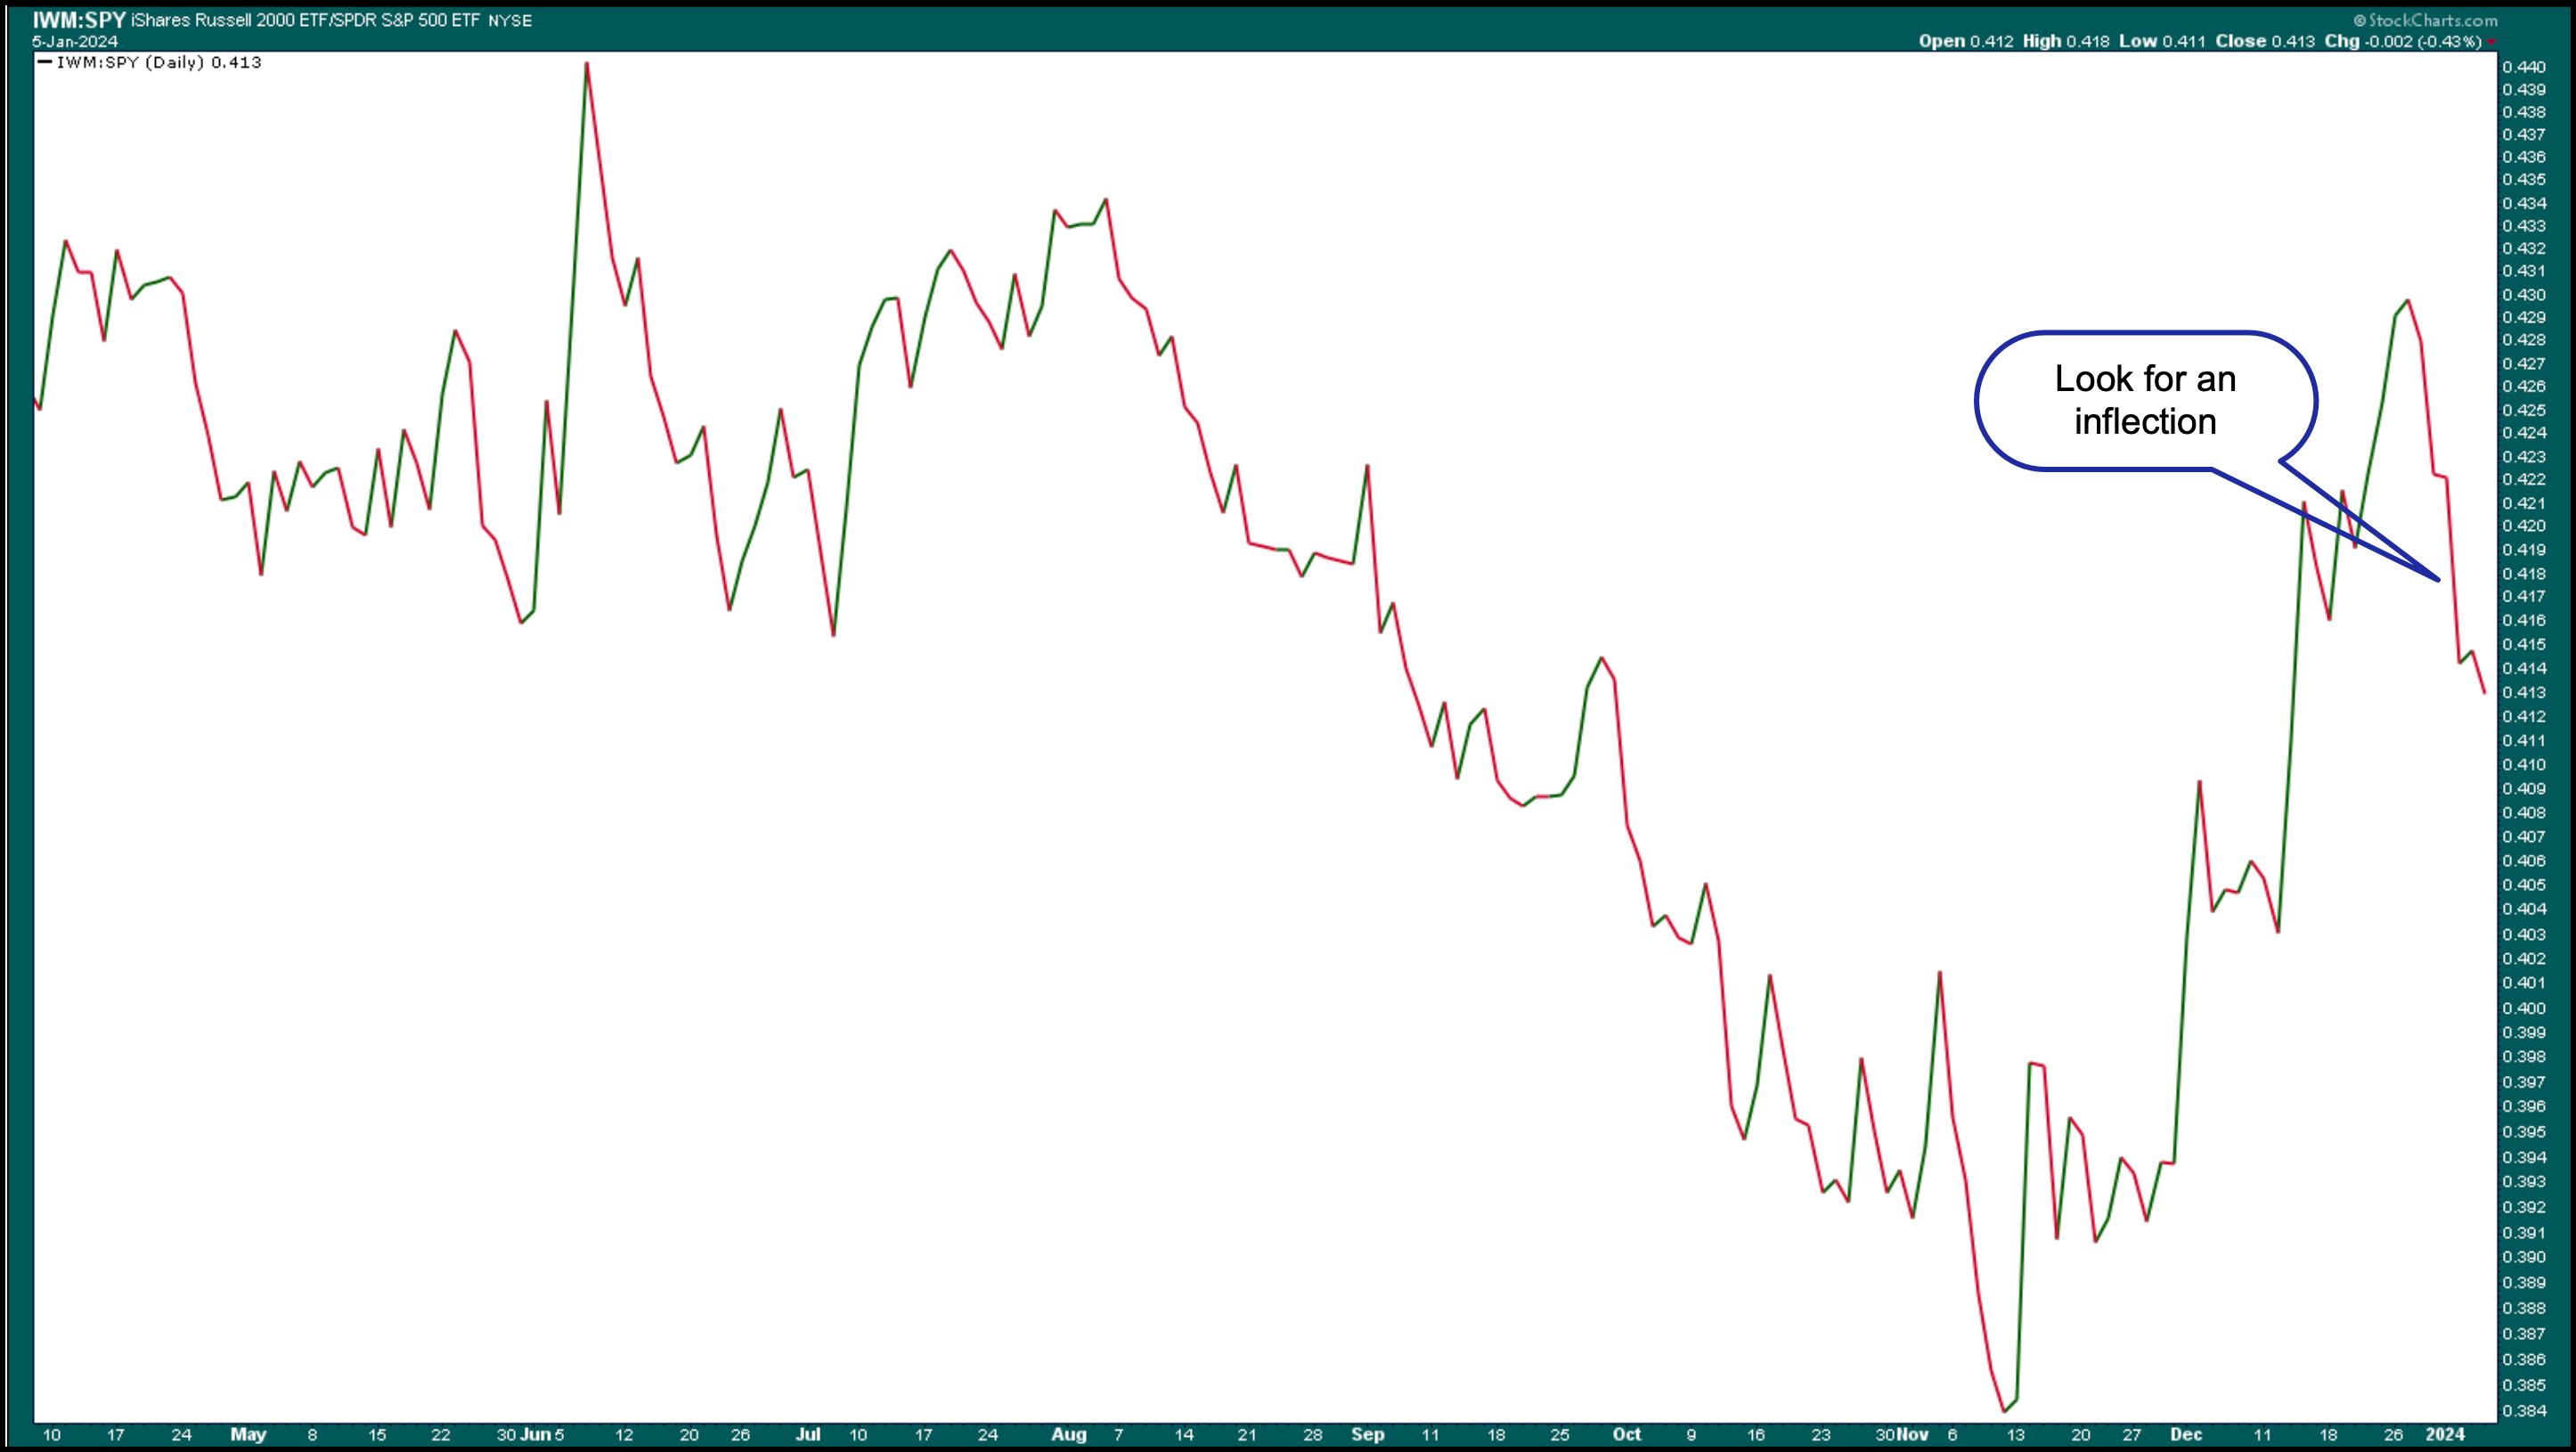
CHART 4. SMALL CAPS VS. LARGE CAPS. If the small caps start outperforming the large caps and trend higher, you may want to put more weight on small-cap stocks.Chart source: StockCharts.com. For educational purposes.
If there's a clear rotation and investors gravitate toward small-cap stocks, it may be worth adding more weight to this asset class.
End-of-Week Wrap-Up
- $SPX up 0.18% at 4697.24, $INDU up 0.07% at 37,466.11; $COMPQ up 0.09% at 14524.07
- $VIX down 5.52% at 13.35
- Best performing sector for the week: Health Care
- Worst performing sector for the week: Technology
- Top 5 Large Cap SCTR stocks: Affirm Holdings (AFRM); USX-US Steel Group (X); Coinbase Global (COIN); PDD Holdings (PDD); Karuna Therapeutics (KRTX)
On the Radar Next Week
- December CPI
- December PPI
- Earnings season kicks off with Bank of America (BAC), JP Morgan Chase (JPM), Wells Fargo (WFC), Citigroup (C), Delta Airlines (DAL), and more.

Disclaimer: This blog is for educational purposes only and should not be construed as financial advice. The ideas and strategies should never be used without first assessing your own personal and financial situation, or without consulting a financial professional.
Happy charting!


