TAKEAWAYS
- The Fed leaves interest rates unchanged as expected, but investors weren't happy
- S&P 500, Dow Jones Industrial Average, and Nasdaq Composite all close lower after Fed decision
- The 10-year Treasury yield falls to a three week low
Will the Fed cut interest rates at their March meeting? Investors were looking for an answer from Fed Chairman Jerome Powell when he took the podium today. Alas, Powell was noncommittal to that, which wasn't what the stock market wanted to hear.
The broad stock market indexes—the Dow Jones Industrial Average ($INDU), S&P 500 ($SPX), and Nasdaq Composite ($COMPQ)—fell even further after Powell took the podium. All three indexes closed lower today—the S&P 500 down 1.61%, the Dow Jones Industrial Average down 0.82%, and the Nasdaq Composite down by 2.23%. Communication Services and Technology sectors were the worst-performing sectors today.
The daily chart of the S&P 500 below shows that, in spite of today's decline, the index is still in an uptrend. The Fibonacci retracement level annotation from the January 4, 2022 high to the October 13, 2022 low shows the 100% retracement level coinciding with the 21-day exponential moving average (EMA). This could be the first support level to watch for. If the S&P 500 continues lower and hits its 50-day simple moving average (SMA), the uptrend would no longer be valid, and you'd have to look for price action at the next support level. As it stands now, it could be the 50-day SMA, but that could change.
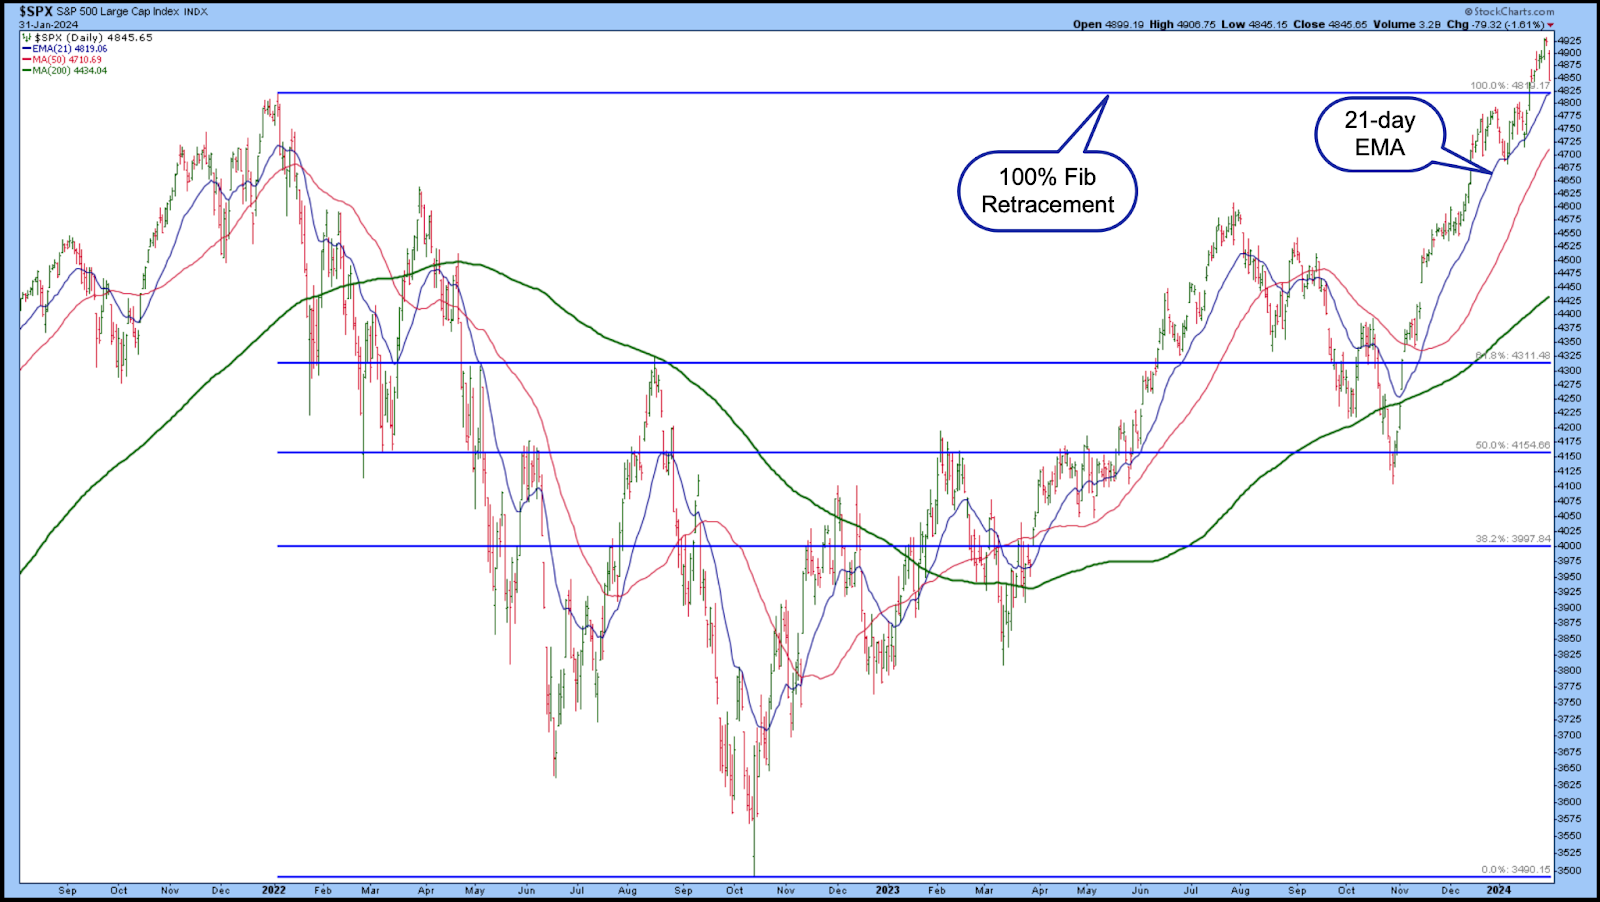
CHART 1. S&P 500 INDEX CLOSE TO ITS FIRST SUPPORT LEVEL. The 21-day exponential moving and the 100% Fibonacci retracement level coincide at around 4825. The S&P 500 closed at 4845.65 on Wednesday. Chart source: StockCharts.com. For educational purposes.
Fed Speak
Today's price action indicates how heavily the stock market had priced in a March rate cut. Prior to today's presser, according to the CME Fedwatch Tool, there was about a 50% probability of a rate cut in March. But since then, the likelihood of a rate cut has dropped to around 36%.
Even though Chairman Powell stated that the economy has made good progress, the supply and demand conditions in the labor market have come into better balance, and inflation has eased, the Federal Open Market Committee (FOMC) needs greater confidence that inflation is moving toward their 2% target.
Powell stated that the Fed is in "risk management" mode, and the timing of rate cuts is critical. Too soon may reverse the progress made so far. As a result, the Fed is prepared to hold the interest rate steady for longer if needed. The decision, as always, is data-dependent.
One point Powell brought up several times is the labor market's strength. That area is strong, but wants to see the supply and demand forces come into balance. Today's ADP private-sector jobs report showed lower-than-expected new jobs. Let's see what Friday's January jobs report reveals, as, after hearing from Powell today, investors will pay close attention to Friday's data. One more month of encouraging data is a move toward interest rate cuts, maybe not in March, but possibly in May. But if the labor market keeps getting stronger, expect further selling to take place.
Another point Powell brought up is the Fed continues to be committed to bringing inflation down to 2%. The risk is that inflation could stabilize above 2%, so the FOMC is not rushing to cut rates.
The benchmark 10-year US Treasury Yield Index ($TNX) fell on Wednesday (see chart below), closing at 3.97%, near its January 12 close.
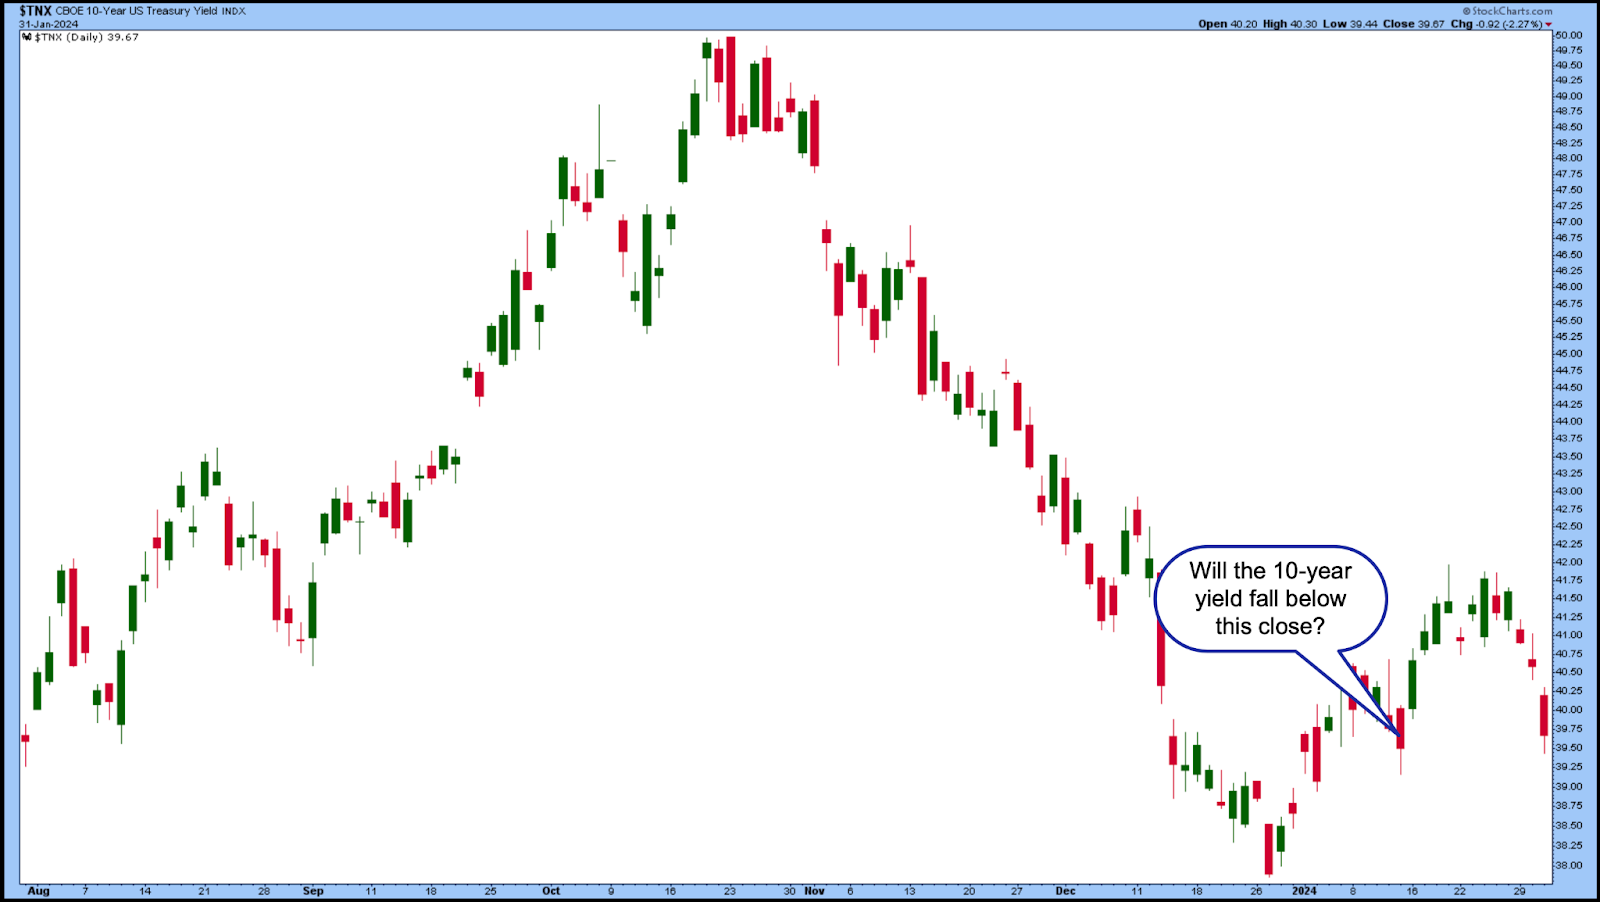
CHART 2. DAILY CHART OF 10-YEAR US TREASURY YIELD INDEX. A fall in yields is related to the government's funding plan. How much further can the 10-year yield fall?Chart source: StockCharts.com. For educational purposes.
On another note, shares of Alphabet (GOOGL), Microsoft (MSFT), and Advanced Micro Devices (AMD) all fell after the companies reported their quarterly earnings after Tuesday's close.
Does today's decline mean we'll see a correction? One day doesn't make a trend, so watch the support area on the S&P 500 and other indexes. The economy is still strong and, for as long as that's the case, it's likely stocks will hit a support level and rebound.
Disclaimer: This blog is for educational purposes only and should not be construed as financial advice. The ideas and strategies should never be used without first assessing your own personal and financial situation, or without consulting a financial professional.
Happy charting!


