TAKEAWAYS
- Combining fundamental forecasts with seasonality patterns offers a potent strategy for identifying tradable opportunities in specific sectors
- The Energy (XLE), Utilities (XLU), and Materials (XLB) sectors exhibit the strongest seasonal performance in the near-term
- Seasonality charts provide valuable insights, but checking overall stock market conditions and technical trading signals further confirms a high probability trade
When we think about sector rotation, we think about fundamentally-based forecasts linked to the stages of the economic cycle (i.e. business cycle). In contrast, when we think of seasonality forecasts, we think of a technically-based context defined by average historical price performance, typically on a monthly basis.
Combining both approaches might be an effective way to identify near-term trading opportunities. In short, you'd be looking for sectors which analysts expect to perform well in the coming months, while drilling down on a sector's seasonality patterns to anticipate historically strong months which may be tradable. Finally, you'd check these projections against the current price action to see whether the technicals are favorable for trading.
Sectors with the Strongest Near-Term Seasonal Performance
Using the SPDR Select Sector ETFs as sector proxies, the three sectors with the strongest seasonal performance in the near term are Energy Select Sector SPDR Fund (XLE), Utilities Select Sector SPDR Fund (XLU), and Materials Select Sector SPDR Fund (XLB).
In terms of fundamentals, all three are expected to see growth in 2024. Energy faces volatility driven by geopolitical and renewable energy transitions, while the utilities sector is seen as a more stable investment, with a focus on renewables and infrastructure. The materials sector could witness growth, benefiting from favorable supply-demand dynamics, anticipated interest rate changes, and attractive valuations.
Seasonal Performance vs. the S&P 500
When you're making investing or trading decisions based on seasonality patterns, it's always a good idea to check an asset's seasonal performance against the broader market. Even if an asset (or, in our case, a sector) performs well in a given month based on its own history, that might not mean much if it underperforms the S&P 500. You're facing an opportunity cost in which you might benefit from trading another asset.
XLE, XLU, and XLB all have strong 10-year seasonal performance in April, which is coming up soon. Let's take a broader look at their performances and compare it with the broader market (see table below).
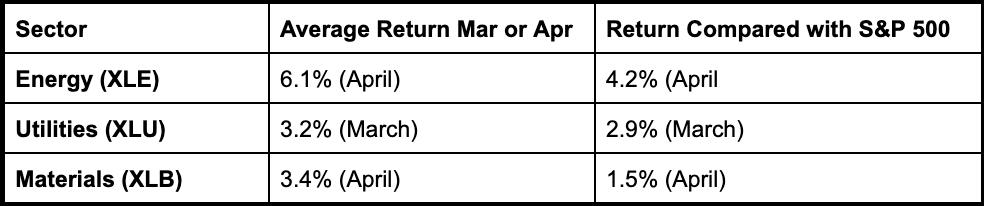
Looking at the stats above, XLE is the strongest performer. While XLB's average return is higher than XLU, when compared with the S&P 500, XLB underperforms XLU. Let's focus on the top performer, XLE.
XLE's Seasonality Profile
Using StockCharts' Seasonality Profile chart, let's take a closer look at XLE's 10-year performance.
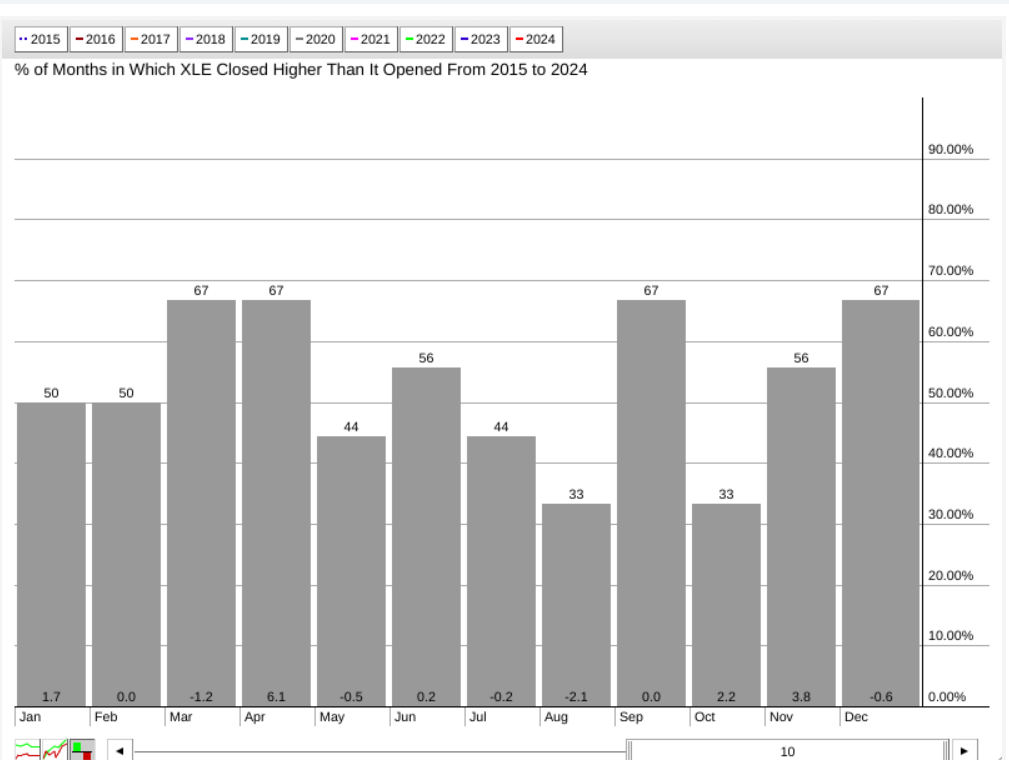
CHART 1. XLE'S 10-YEAR SEASONALITY PROFILE. Just because a given month has a higher close percentage doesn't mean it's a favorable month to trade. You have to look at its average return (bottom of the bar) and compare both figures across all other months. Chart source: StockCharts.com. For educational purposes.
While XLE has a higher-close rate of 67% in both March and April over a 10-year period, its average return in April (6.1%) far exceeds the average negative return (-1.2%) in March. April is XLE's strongest seasonal month.
But what do these stats mean when compared with the S&P 500? Does it outperform or underperform the broader market?
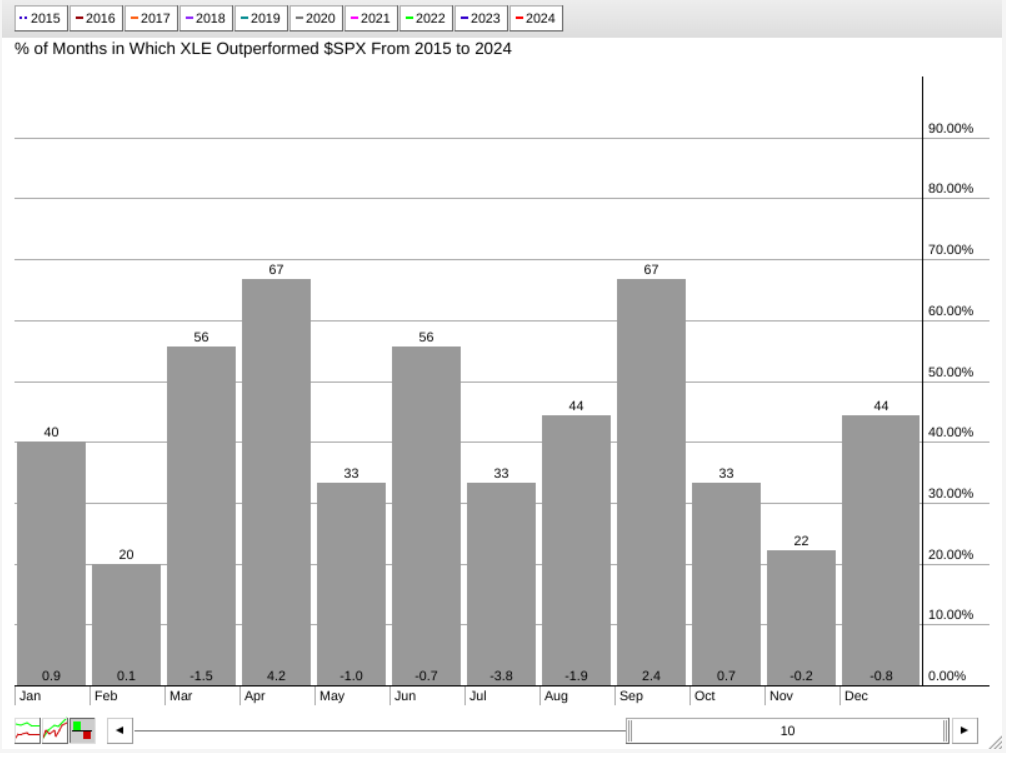
CHART 2. XLE'S 10-YEAR SEASONAL PERFORMANCE COMPARED WITH THE S&P 500. When you view seasonality using relative performance, things can sometimes change drastically. In the case of XLE, March is still weak, April is still its strongest month, and the higher close rate in April is the same compared to the S&P 500.Chart source: StockCharts.com. For educational purposes.
Looking at XLE's relative seasonal performance against the broader market, you can see that it outperforms the S&P 500 in the month of April (4.2%) while maintaining its 67% rate of higher closes.
Is XLE's March Weakness a Setup for an April Surge?
Looking at a daily chart of XLE, you can see that it has been trading sideways since the middle of October.
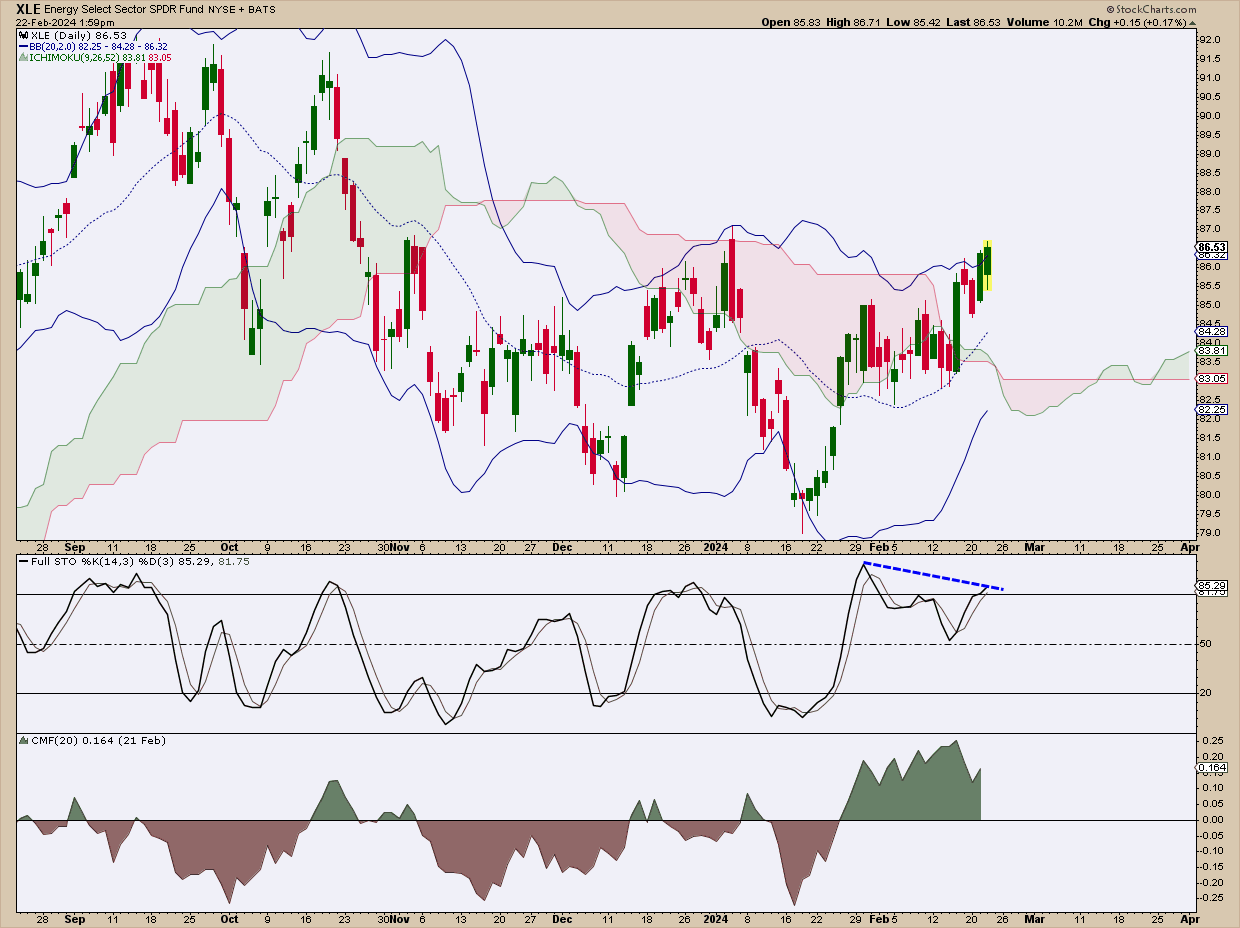
CHART 3. DAILY CHART OF XLE. All indicators on the chart serve a purpose in terms of support and confluence: gauging momentum, buying pressure, and identifying a potential support range. Chart source: StockCharts.com. For educational purposes.
While prices have surged, XLE also closed above the upper Bollinger Band® earlier in the week. A close above the band (2nd standard deviation) signals a strong potential for prices to decline, possibly toward the middle band.
There's also a bearish divergence in the Stochastic Oscillator (see blue dashed line), which has declined while still giving an overbought signal. Both signals indicate the likelihood that XLE may be dipping soon.
On the bullish side, you can also see from the Chaikin Money Flow (CMF) that buying pressure has ramped up and is still far above the zero line. Meanwhile, an Ichimoku Cloud is plotted in the chart to provide some trend context (which is slightly bullish) and a possible range for support.
So, if you're bullish on XLE and agree with the seasonal March weakness and April strength thesis, you'd probably wait for prices to fall between $83 and $84 in the coming month. Set a price alert at $85 to alert you to a potential trade.
The $83 to $84 level would coincide with the lower or middle Bollinger Band (if prices decline) and the cloud itself (the space between Senkou Span A and Senkou Span B). Preferably, you'd see a decline in the Stochastic Oscillator while the buying pressure on the CMF maintains itself above the zero line. Next, you'd look for an upward reversal on strong momentum before deciding where, exactly, to place your buy stop (there are many ways to determine this, and it depends on your trading methodology).
The Bottom Line: The Challenge of Using Seasonality Profiles
StockCharts' Grayson Roze, in his video explaining how to use the company's seasonality charts, makes it clear that seasonality is an effective tool for contextualization. This means that you already have a trade idea, and you use its seasonality profile to gain more information that may help you evaluate the odds of your trading thesis.
However, starting with the seasonality chart to generate trading ideas can prove more challenging and problematic when the technicals don't suggest an immediate trading opportunity. Nevertheless, if seasonal consistency takes place, you've potentially unlocked an opportunity that other traders might not have expected.
Sectors rotate on a long-term basis in relation to the business cycle and on a short-term basis in relation to the intra-year supply/demand situation of the businesses they comprise. So, there may be an adequate reason to trade sectors on a short-term basis in response to their seasonal demand.
It may be difficult to decipher at times. Still, if a seasonality reading gives you an edge in anticipating a potential near-term move, it might be well worth the small effort it takes to analyze its seasonality profile.
How to Access the StockCharts Seasonality Tool
There are different ways to access the seasonality tool in StockCharts.
- Click the Charts & Tools tab at the top of the StockCharts page, enter a symbol in the Seasonality panel, and click "Go."
- Enter the symbol in the ChartBar at the top of the page and select "Seasonality" from the dropdown menu on the left.
- From Your Dashboard, in Member Tools, click on Seasonality.
- Below the seasonality chart, you'll find links to instructions and quick tips that give more detailed instructions.
Disclaimer: This blog is for educational purposes only and should not be construed as financial advice. The ideas and strategies should never be used without first assessing your own personal and financial situation, or without consulting a financial professional.
Happy charting!


