TAKEAWAYS
- Investors are anxiously awaiting the PCE data to get clues on when the Fed will start cutting interest rates
- Small cap stocks look like they want to break out of a range and join the bullish equity rally
- Bitcoin is having a strong week with three consecutive significant up days as it inches toward its all-time high

This is a big week for economic data—durable goods, consumer confidence, GDP, and PCE.
Durable goods fell in January, which didn't impact the stock market. Neither did the revised GDP number, which came in slightly lower.
Inflation In Focus
Traders are anxiously awaiting the PCE data to find clues as to when the Fed will likely start cutting interest rates. Treasury yields are a little higher, probably because some of the more recent bond auctions on the 2- and 5-year Notes went well. The US dollar is moving lower.
It's almost as if the stock market has adopted a "wait and see" approach. You'll have to wait until Thursday morning when the PCE comes—will the stock market make a big move in either direction?
Times Are Changing
This week saw some changes in the Dow Jones Industrial Average ($INDU) and Dow Jones Transportation Average ($TRAN). Amazon (AMZN) has joined the Dow, replacing Walgreens Boots Alliance (WBA). It remains to be seen if this addition will help the DJIA's performance, bringing it closer to the performance of the S&P 500. What's interesting is that between announcement and inclusion, stocks that are going to be added to an index tend to rise. After that, the stock price often declines, and the stock that was kicked out tends to do better. AMZN's stock price closed lower today, and the Dow is down about 97 points. But one day doesn't make a trend, so there's no need to sell AMZN.
Uber Technologies' addition to $TRAN is an exciting change, since most companies that make up the $TRAN are shipping and freight companies. The addition of AMZN and UBER into the two Dow Jones indices reflects changing times.
It's interesting to see how $TRAN has performed compared to $INDU (see chart below). While $INDU was hitting new highs, $TRAN was lagging. This goes against one of the tenets of Dow Theory: if $INDU and $TRAN trend in the same direction, the entire stock market trends in a similar direction. $TRAN isn't hitting highs while $INDU continues to hit new highs.
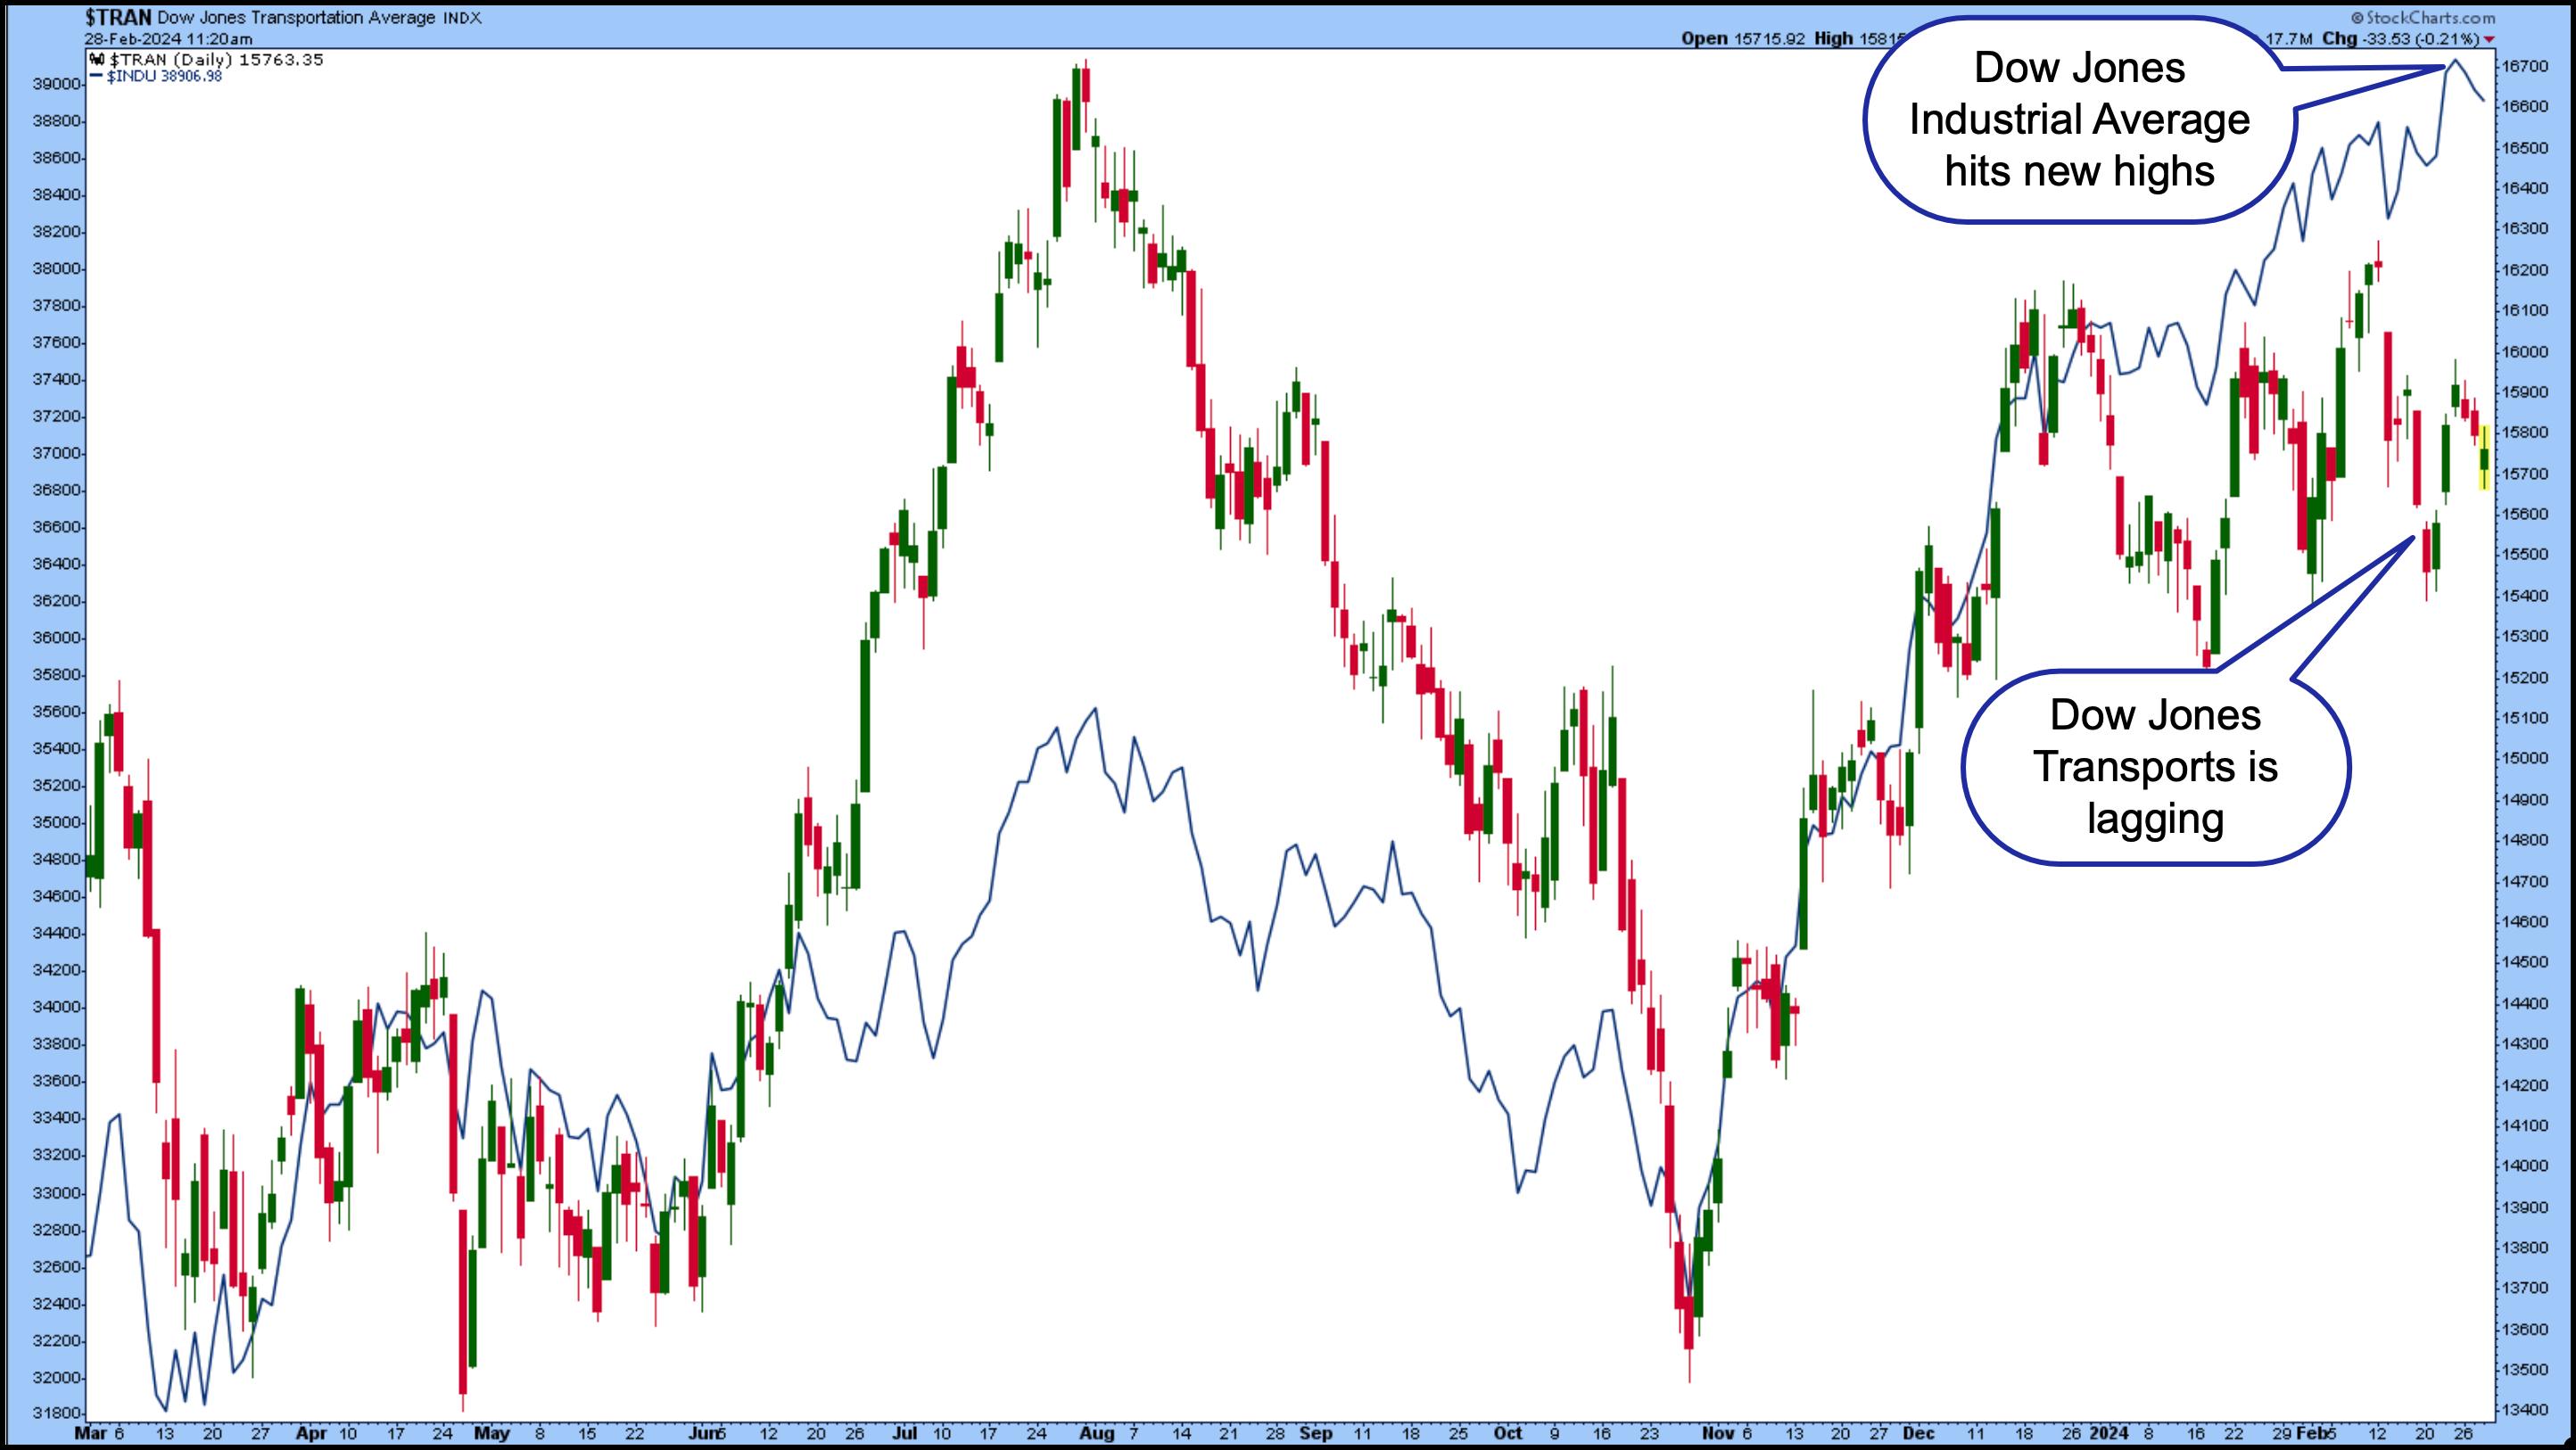
CHART 1. DOW JONES TRANSPORTATION AVERAGE ($TRAN) VS. DOW JONES INDUSTRIAL AVERAGE ($INDU). While $INDU has been hitting new highs this year, $TRAN hasn't been doing the same thing.Chart source: StockCharts.com. For educational purposes.
Meanwhile, in the equity space, chip stocks continue to carry the broader market higher. It's not just NVIDIA (NVDA); Micron Technology (MU) hit a new 52-week high on the news that it's starting high volume production of its High Bandwidth Memory E3 chips. These chips will be incorporated in the Nvidia H200 graphics processing units. Arm Holdings (ARM) has also been soaring this month after its alliance with some big AI players.
Small-Caps Want To Join the Party
While the semiconductors continue to rally, small-cap stocks don't want to get left behind. The weekly chart of the iShares Russell 2000 (IWM) shows it's trying to break above the resistance of a trading range (see weekly chart below). Will it succeed?
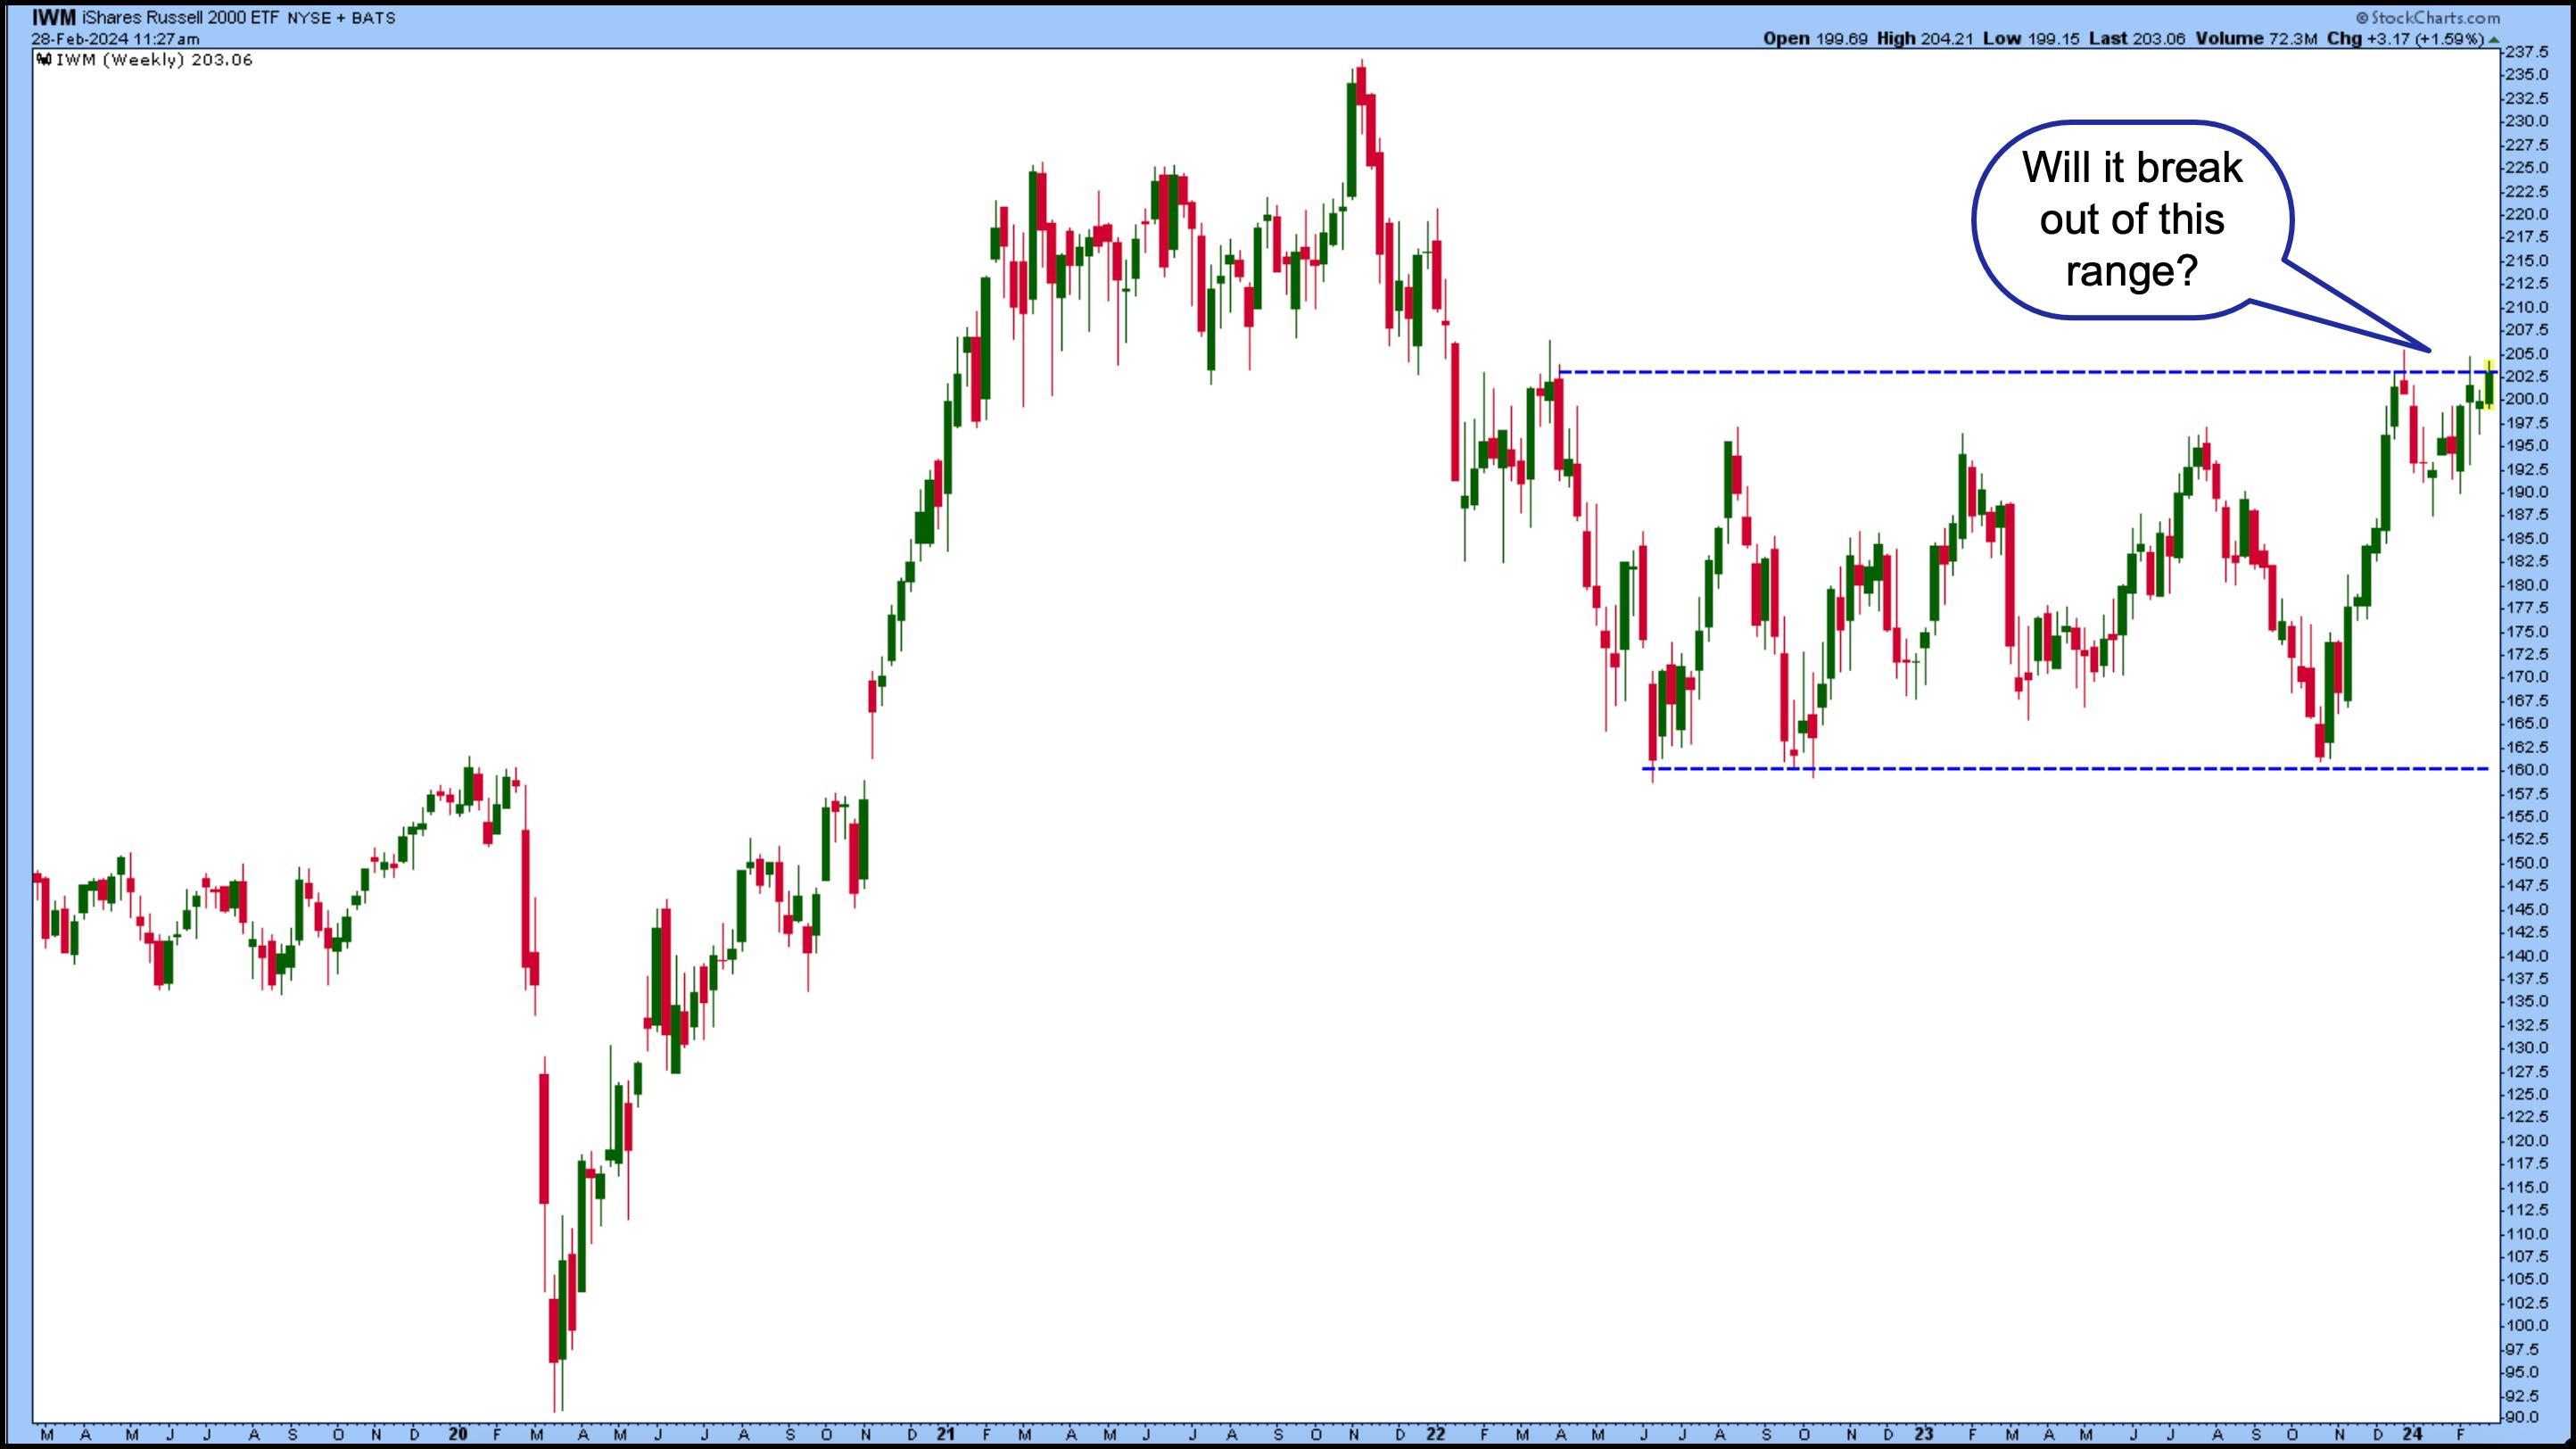
CHART 2. ISHARES RUSSELL 2000 ETF (IWM) CLOSE TO BREAKING OUT OF A RANGE. The big question is, will IWM break out, or will it retreat to its trading range? A lot rests on when the Fed will start cutting interest rates.Chart source: StockCharts.com. For educational purposes.
It's still got a long way to go before hitting its November 2021 high. The first Fed rate cut may be when small caps take off, so monitor the S&P 600 Small Cap Index ($SML) on the StockCharts Market Overview panel (see below).
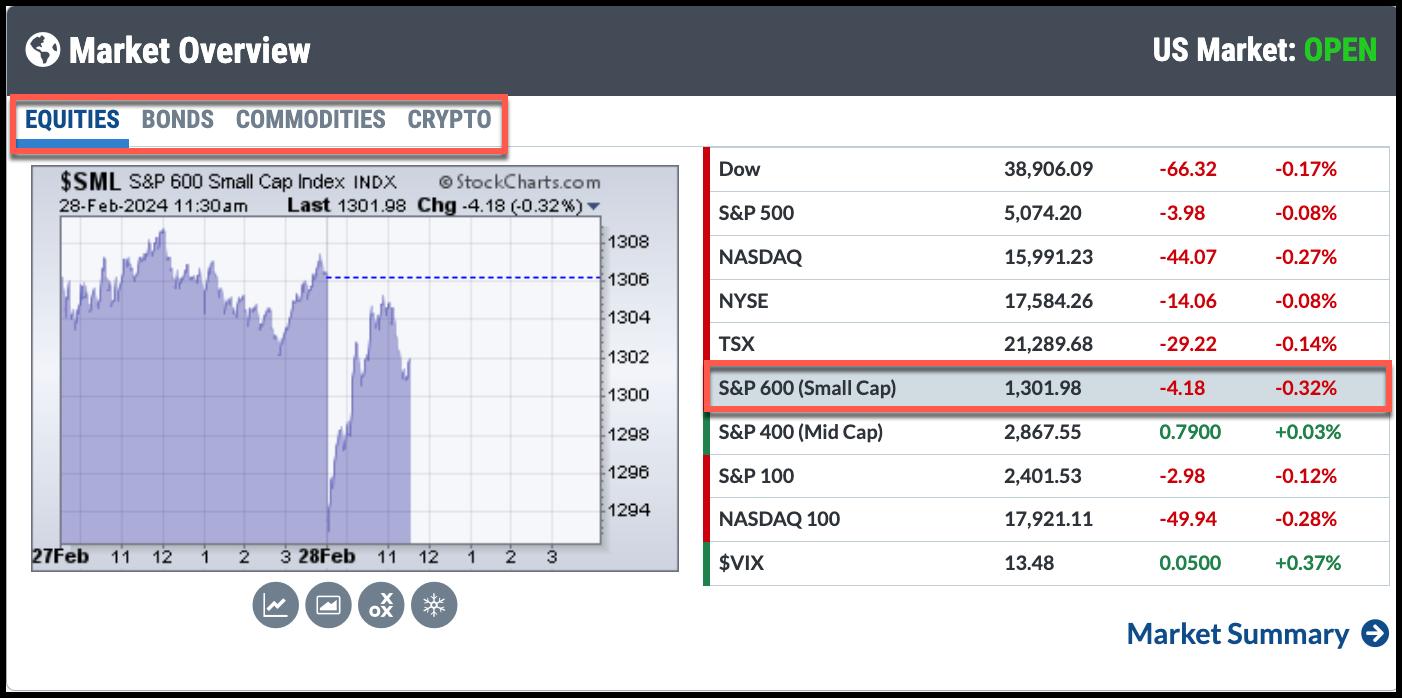

Cool StockCharts Tip.
If you want a bird's eye view of the stock market, select the different tabs in the Market Overview panel—Equities, Bonds, Commodities, and Crypto—to see how the broader market is performing.
And Don't Forget Crypto
One area that's been showing strength is cryptocurrencies. Bitcoin ($BTCUSD) is showing its bullish power this week. It's on tap to have three consecutive big up days (see chart below). This spike has helped stocks like Coinbase (COIN), Marathon Digital (MARA), and Riot Platforms (RIOT) move higher. COIN and MARA hit a new 52-week high today.
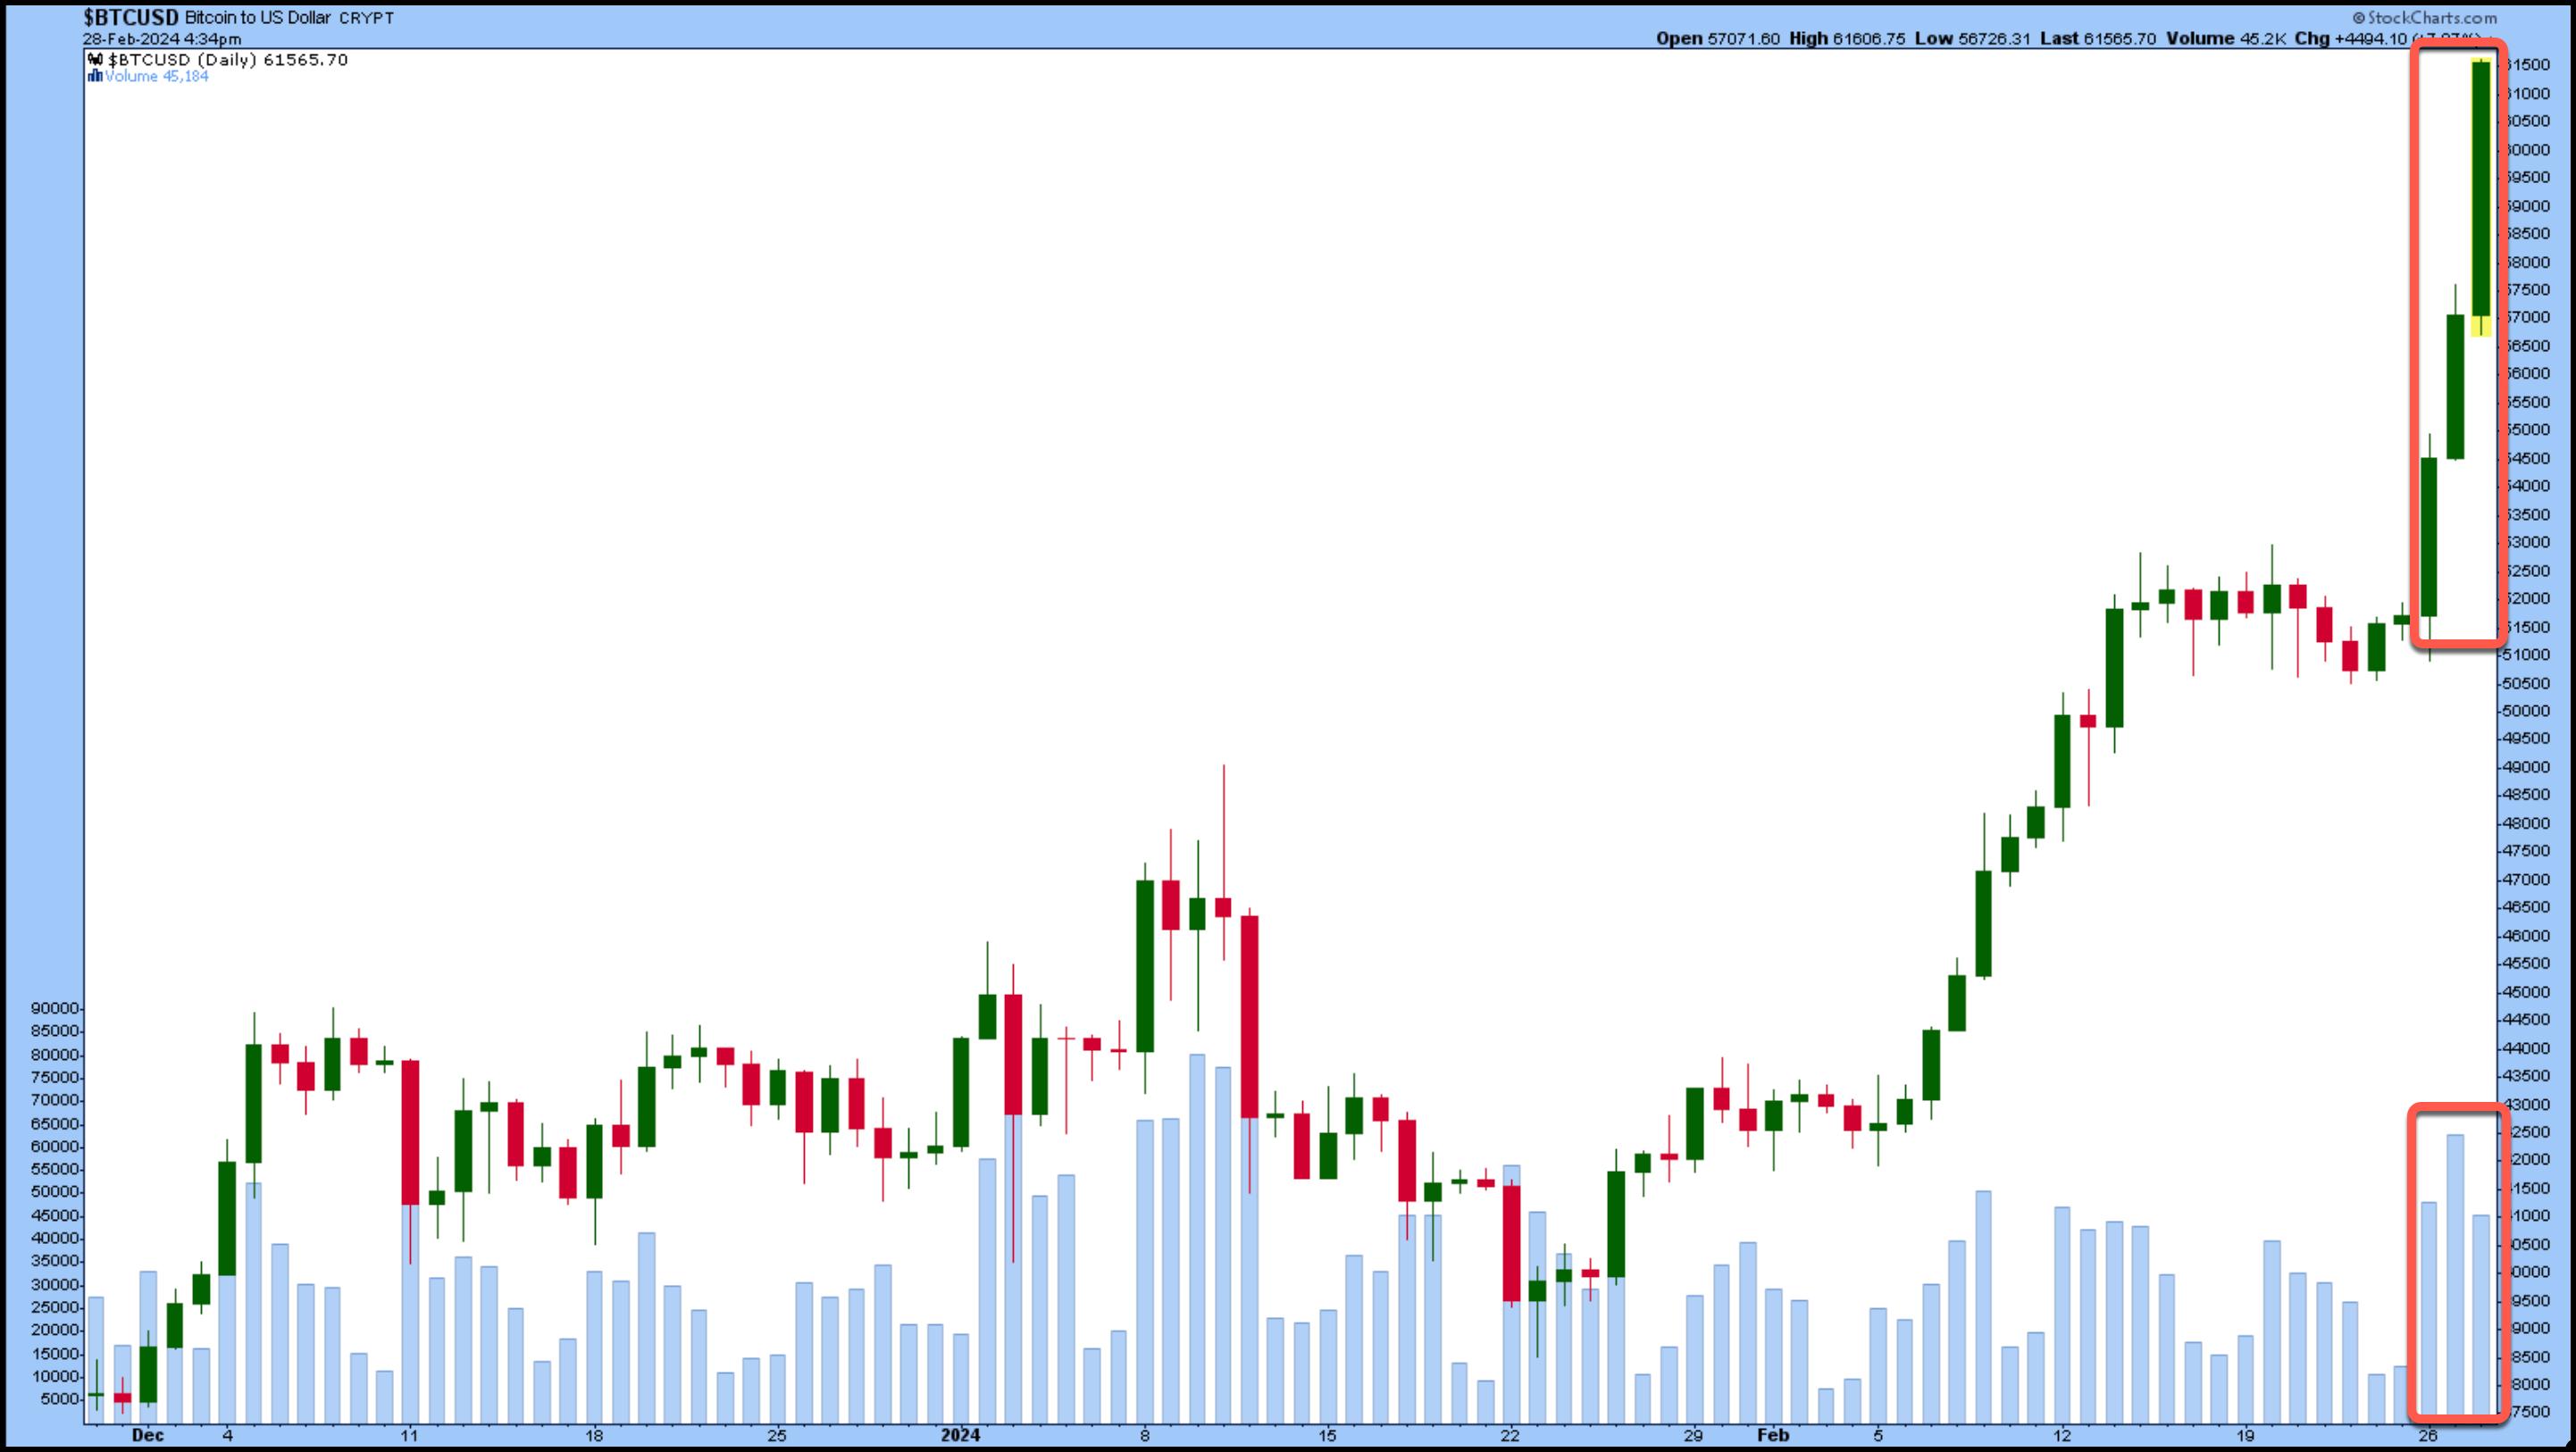
CHART 3. DAILY CHART OF BITCOIN TO US DOLLAR. Three big up days with above-average volume shows this cryptocurrency has momentum. It's not too far away from its all-time high of 69355.Chart source: StockCharts.com. For educational purposes.
The Bottom Line
Equities are rallying, especially due to the AI buzz, so it's probably not the right time to be bearish on equities. The CBOE Volatility Index ($VIX) is still relatively low and shows no signs of investor fear. Thursday's PCE data will probably give the market a reason to move up or down. That's tomorrow morning (Thursday) at 8:30 AM ET. Pre-market trading should provide some clues.

Disclaimer: This blog is for educational purposes only and should not be construed as financial advice. The ideas and strategies should never be used without first assessing your own personal and financial situation, or without consulting a financial professional.
Happy charting!


