TAKEAWAYS
- A stronger-than-expected jobs report sent the stock market higher
- Several stocks and ETFs hit new all-time highs today
- Commodity prices continue to rise

One day doesn't make a trend—that's one lesson we learned from this week's stock market action.
The March non-farm payrolls data revealed that the US economy added 303,000 jobs, which is higher than the estimated 200,000. Additionally, the unemployment rate dropped to 3.8%, down from 3.9%. After yesterday's massive selloff—mainly due to comments from Fed officials suggesting interest rate cuts may not happen this year—you'd think today's strong jobs report would have made investors jittery. It would extend the narrative that interest rates will remain on hold for longer.
But that's not what happened. Investors celebrated the strong jobs report, with equities and Treasury yields rising. The broader indexes closed higher, and the VIX pulled back to 16.13, which was a little high but not too alarming. Although the indexes were down for the week, seeing the broader markets close higher was encouraging after the selling pressure we saw on Thursday.
It's possible the stock market was blowing off some steam. Nothing goes up in a straight line, and investors should expect an extended market to pull back. Yesterday's pullback, although massive, was only about a 1% decline. Given that economic data is healthy, investors have no reason to worry. This week, we had good manufacturing and jobs data, so there's no reason for any panic.
Several stocks made all-time highs, as can be seen by the extensive list of stocks that made the StockCharts New All-Time Highs scan. Some notable names filtered in the scan are Meta Platforms (META), ConocoPhillips (COP), and Exxon Mobil (XOM). Several companies in the Energy sector were filtered in this scan.
Energy stocks have been on a tear. The Energy Select Sector SPDR ETF (XLE) reached a new high again, and its steep ascent is still in play. And it's not just oil prices that are going up—the SPDR Gold Shares ETF (GLD) and iShares Gold Trust ETF (IAU) also hit new all-time highs. Commodities continue to show strength, as seen in the Invesco DB Commodity Index Tracking Fund (DBC).
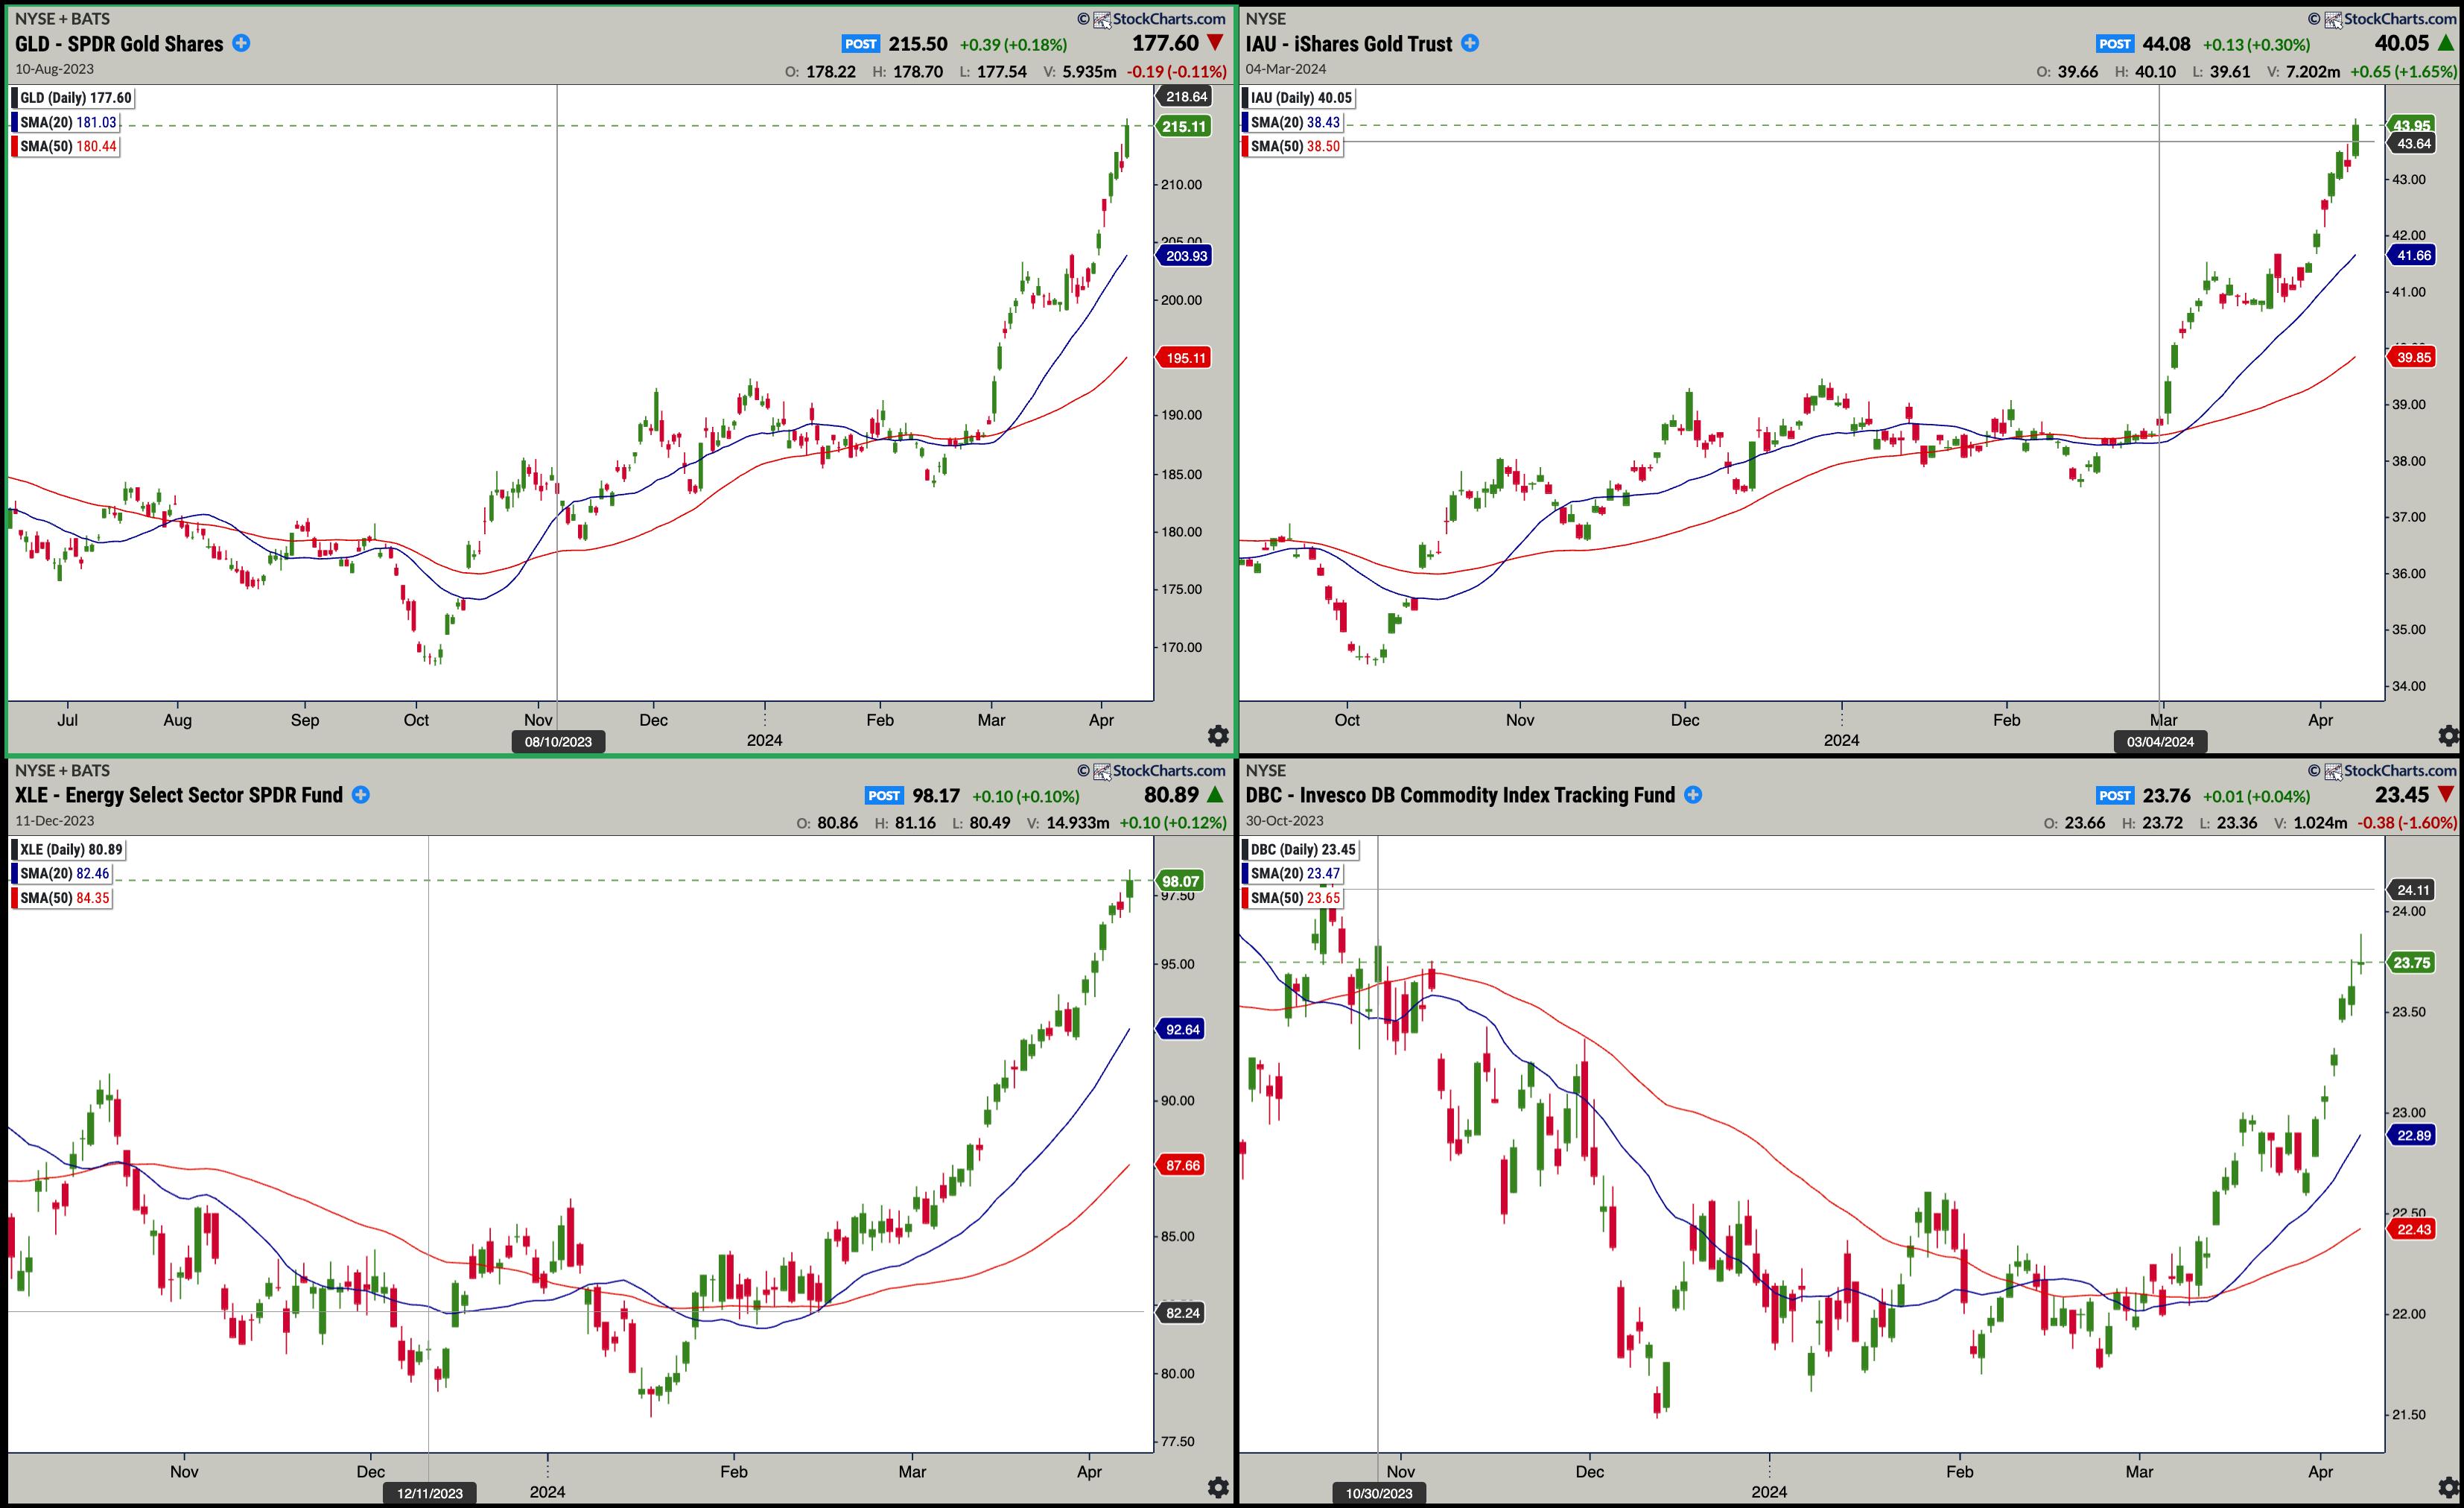
CHART 1. COMMODITY PRICES CONTINUE TO RISE, ESPECIALLY OIL AND GOLD. Oil prices have climbed higher in a short time. Gold and other commodity prices are also rising.Chart source: StockChartsACP.com. For educational purposes.
But it wasn't a great day for all stocks. One stock that got hit hard today was Tesla, Inc. (TSLA). It was one of the most active stocks in the S&P 500, closing lower by 3.59%. The stock is trading below its 200-day simple moving average with a declining relative strength index (RSI), which is getting close to oversold territory. Looking at the weekly chart of TSLA below, the stock is at a support level, but there's room for it to drop much further before seeing any signs of reversal.
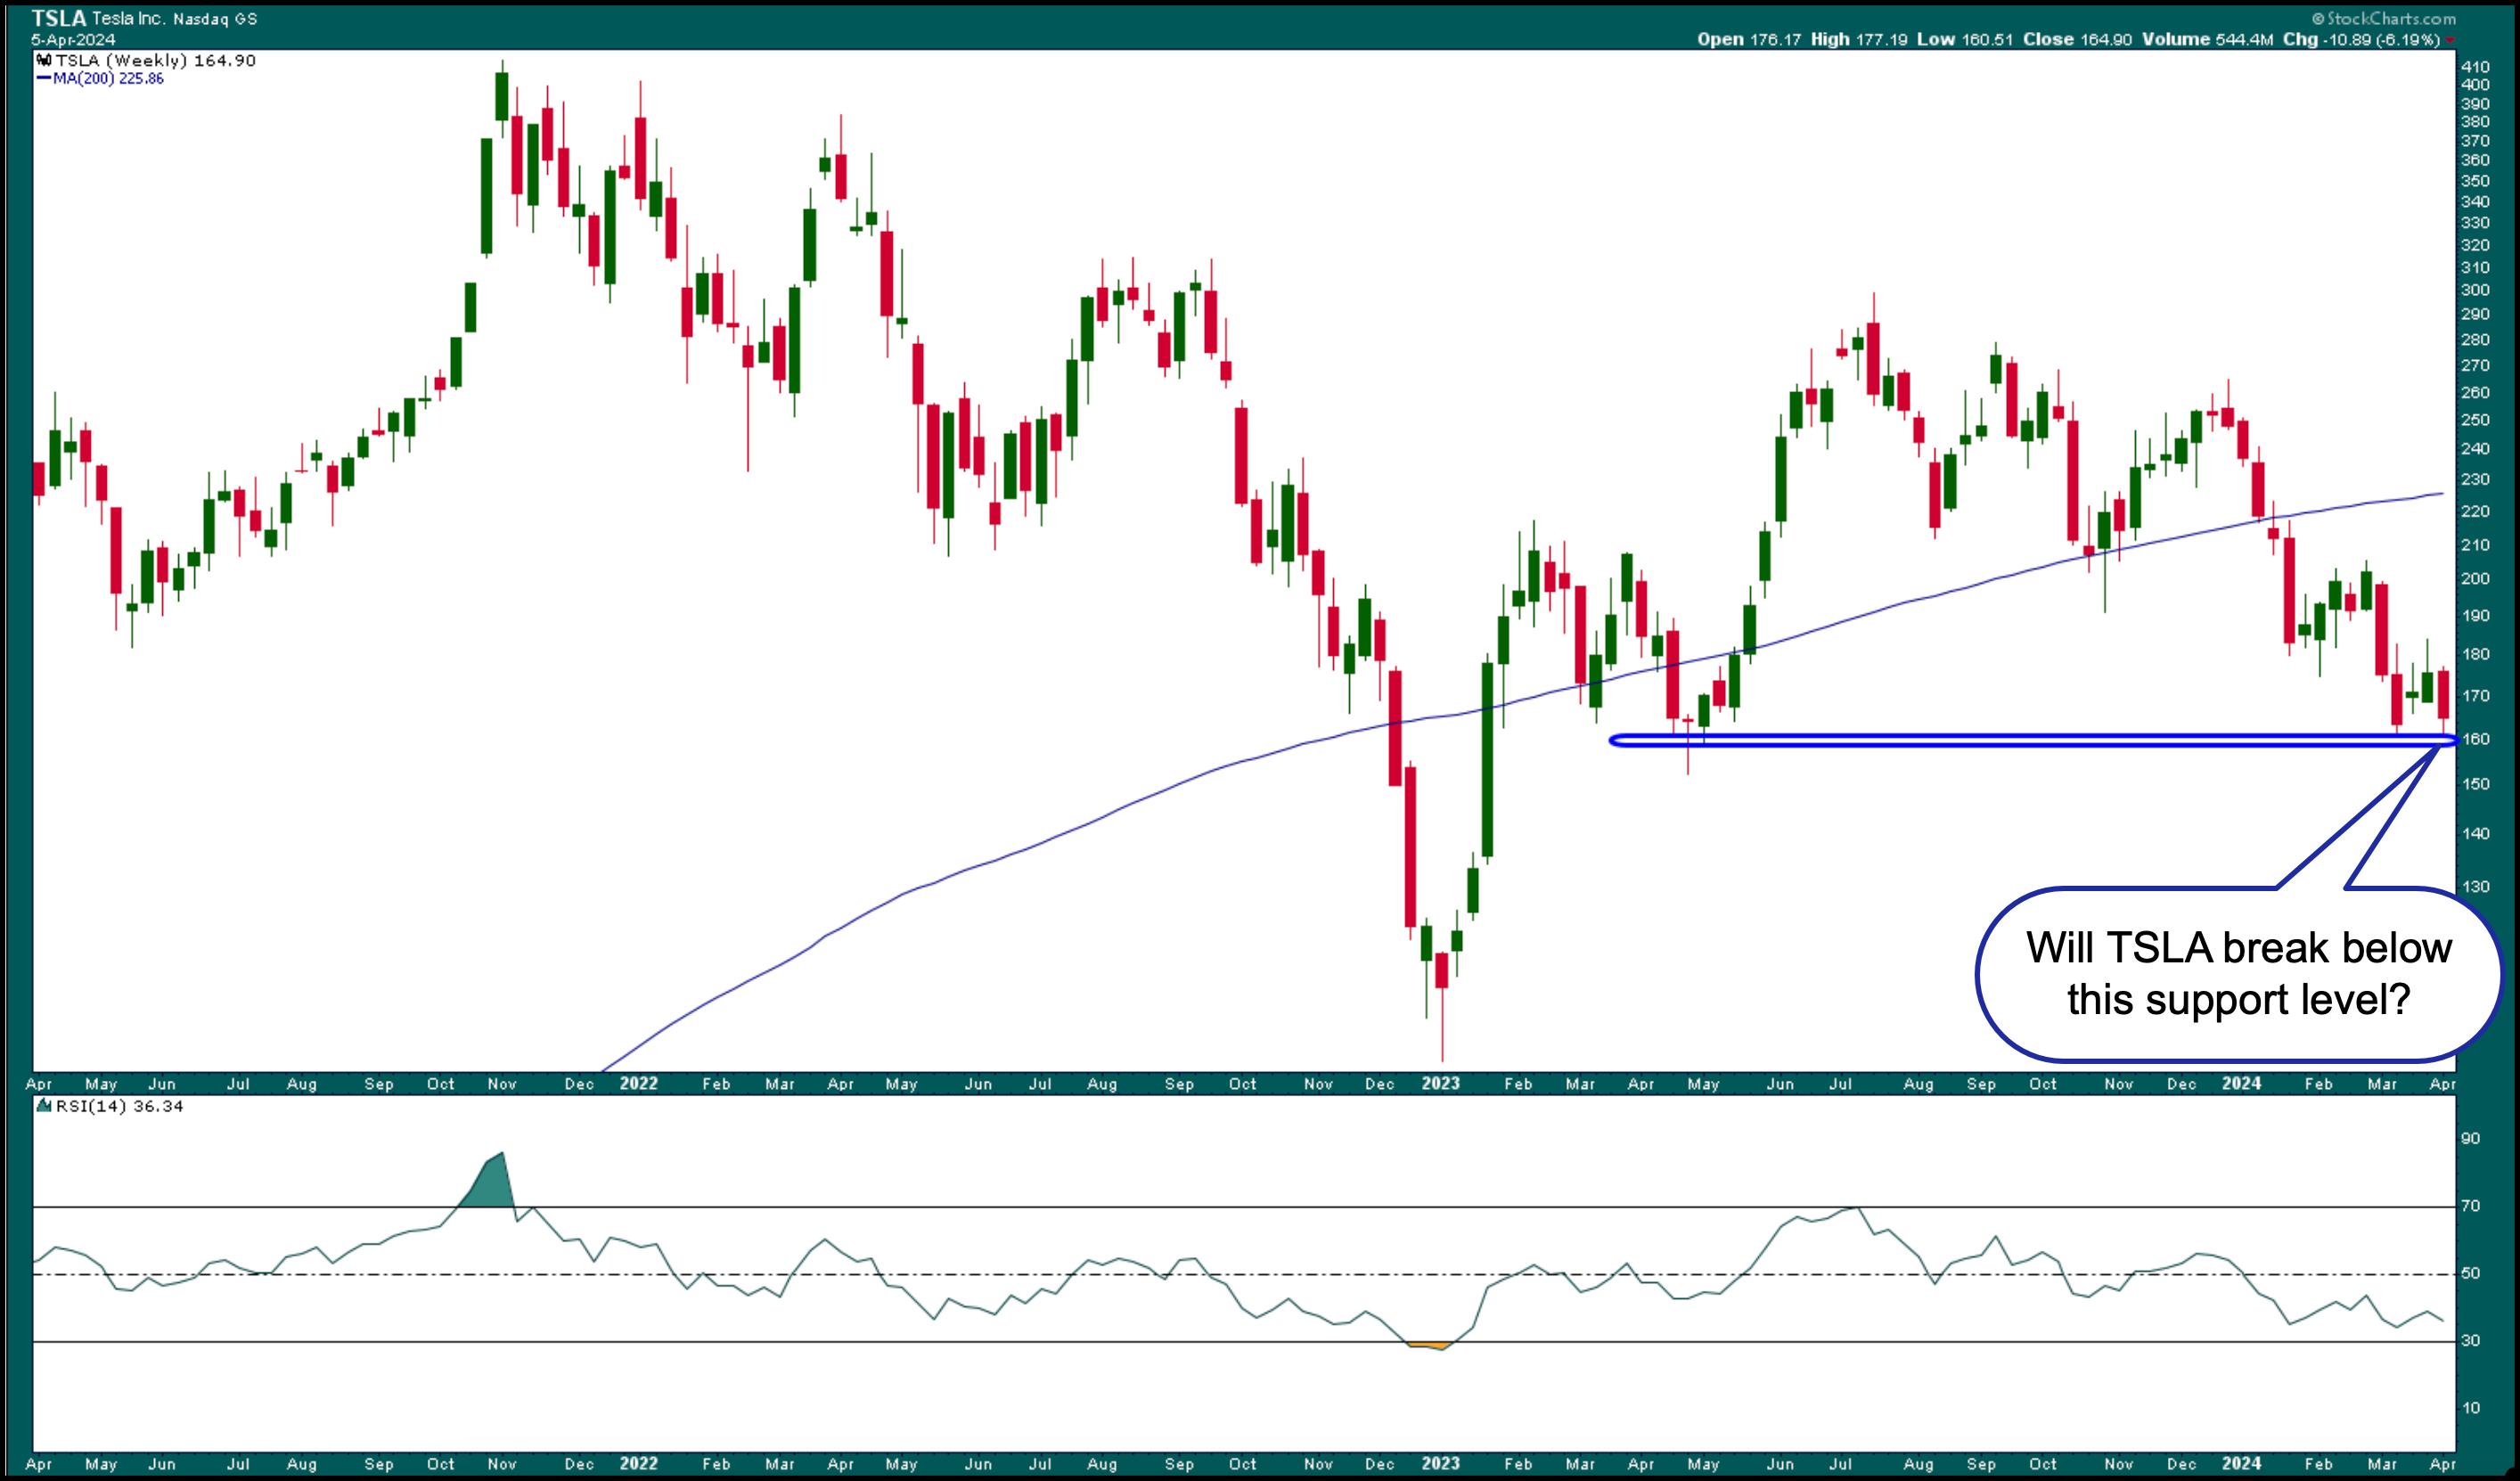
CHART 2. TSLA STOCK COULD BREAK SUPPORT. TSLA's stock price could fall to its next support level at around $102.Chart source: StockCharts.com. For educational purposes.
It's encouraging to see a recovery at the end of the trading week, but what would be even better would be to see a broad-based rally. We may get that as earnings week kicks off. A rotation into Industrials, Financials, and Materials would positively impact the stock market. So watch the StockCharts Sector Summary panel to identify when the rotation begins.
Earnings Showdown
Earnings season kicks off at the end of the week of April 8, starting with the big banks. That means the focus will be on corporate earnings in the next few weeks. According to FactSet, Q1 year-over-year earnings growth rate for the S&P 500 is expected to be 3.6%. If companies report higher-than-expected earnings and revenues, the market will probably continue trending higher.
As long as companies generate positive cash flow and show higher profit margins, investors have no reason to sell their investments.
Important inflation data will also be released next week. The March CPI and PPI will be reported on Wednesday and Thursday. So fasten your seatbelts! Next week could see some choppy trading activity. But don't let a little choppiness make you change your investment strategies, unless there's catastrophic news beyond anyone's control.
End-of-Week Wrap-Up

- S&P 500 closes up 1.11% at 5,204.34, Dow Jones Industrial Average up 0.80% at 38,904; Nasdaq Composite up 1.24% at 16,248.52
- $VIX down 1.96% at 16.03
- Best performing sector for the week: Energy
- Worst performing sector for the week: Health Care
- Top 5 Large Cap SCTR stocks: MicroStrategy Inc. (MSTR); Super Micro Computer, Inc. (SMCI); Coinbase Global Inc. (COIN); Vistra Energy Corp. (VST); Vertiv Holdings (VRT)
On the Radar Next Week
- March Consumer Price Index (CPI)
- March Producer Price Index (PPI)
- More Fed speeches
- Earnings from Citigroup (C), JP Morgan Chase (JPM), Wells Fargo (WFC), Delta Airlines (DAC)
Disclaimer: This blog is for educational purposes only and should not be construed as financial advice. The ideas and strategies should never be used without first assessing your own personal and financial situation, or without consulting a financial professional.
Happy charting!


