TAKEAWAYS
- The possibility of only one interest rate cut and escalation of geopolitical tensions increases uncertainty levels for investors
- The 100-day simple moving average could be the S&P 500's next support level
- Massive selloff in Tech stocks sends the Nasdaq Composite below its 100-day moving average

What a difference a week makes.
Last week, the stock market changed its tune from up, up, up,... to up, down, up, down. That made it feel like investors were uncertain, yet the CBOE Volatility Index ($VIX) wasn't high enough to confirm the fear. This week, the market's singing another tune emphasizing the word "down." This week, the selling pressure was more dominant, especially in the Tech sector. Does this mean the bear is coming out of hibernation?
The Macro Environment
We heard comments from two Federal Reserve Presidents, John Williams and Austan Goolsbee, who left open the possibility of a rate hike. Fed Chair Jerome Powell suggested interest rates could remain higher for longer. Next week, we'll get the March PCE data, and, in light of the Fed comments, it could be higher than estimates.
We'll also get the Q1 GDP, which will probably reveal the continued strength of the US economy. If the economy continues to be resilient, we may not see a rate cut this year. As of now, the stock market has priced in at least one rate cut in 2024, which is different than the four that were expected earlier in the year.
In a "higher for longer" interest rate environment, two events that could have intensified the selling pressure at the end of the week are:
- Escalating geopolitical tensions in the Middle East, which, for the time being, have tapered.
- Options expiration day, which means heavy trading volume.
Nobody wants to open new positions on a Friday, especially after a volatile trading week. Anything could happen over the weekend, and traders would rather be patient and wait to see if the stock market has further to fall before jumping in.
The Broader Market
You've heard the adage, "Markets take the stairs up and the elevator down." You can see this play out in the charts of the broader indexes.
The S&P 500
The S&P 500 ($SPX) closed below 5,000, a significant psychological level. On the daily chart, the index broke below its 50-day simple moving average (SMA) and is now approaching its 100-day SMA. The last six days have been an elevator ride down and, the way the chart looks, there could be more selling next week.
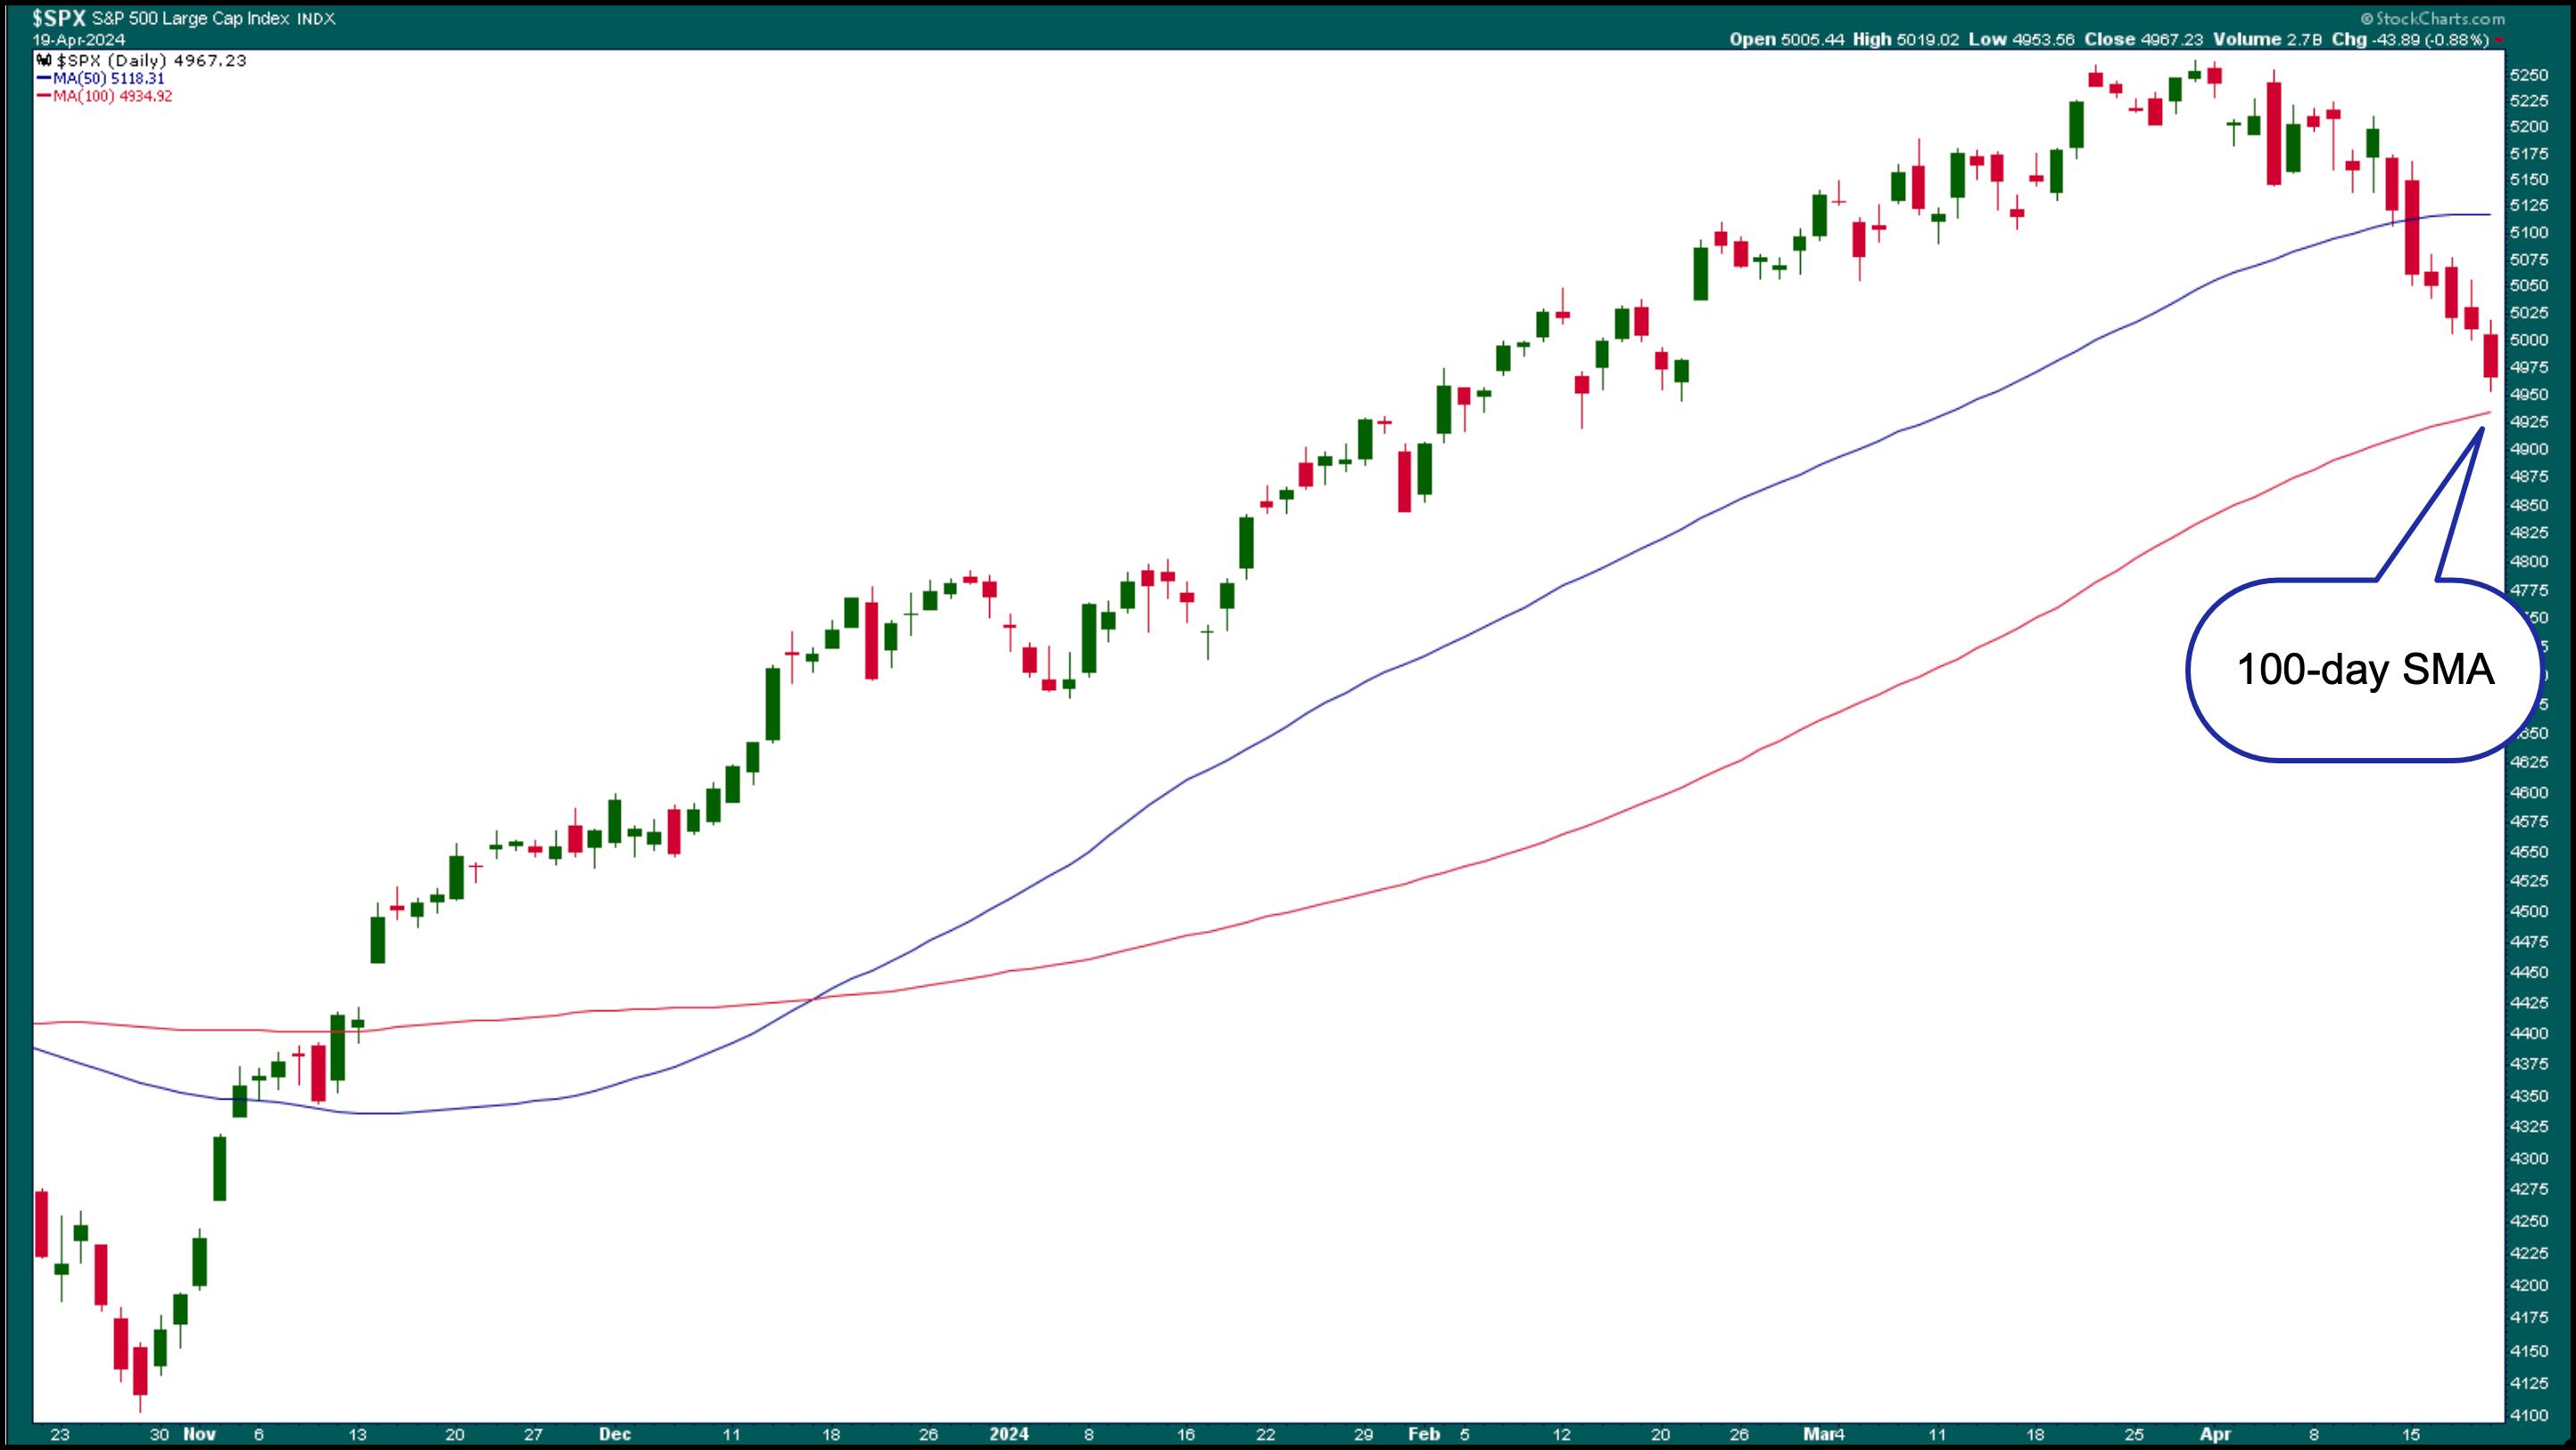
FIGURE 1. DAILY CHART OF THE S&P 500. Since the S&P 500 fell below its 50-day SMA, it's taken the elevator down. The index is now approaching its 100-day SMA, which could be its next support level. Will it fall below the support?Chart source: StockCharts.com. For educational purposes.
On the weekly chart, the S&P 500 is above its 50-week SMA, but has three consecutive down weeks, which doesn't paint a pretty picture. Right now, it looks as if the index has further to fall.
The Dow Jones Industrial Average
After its most recent selloff, the Dow Jones Industrial Average ($INDU) is trading around a support level (December 2023 high). The daily chart below shows that even though the index closed higher on Friday, it hit resistance from its 100-day SMA.
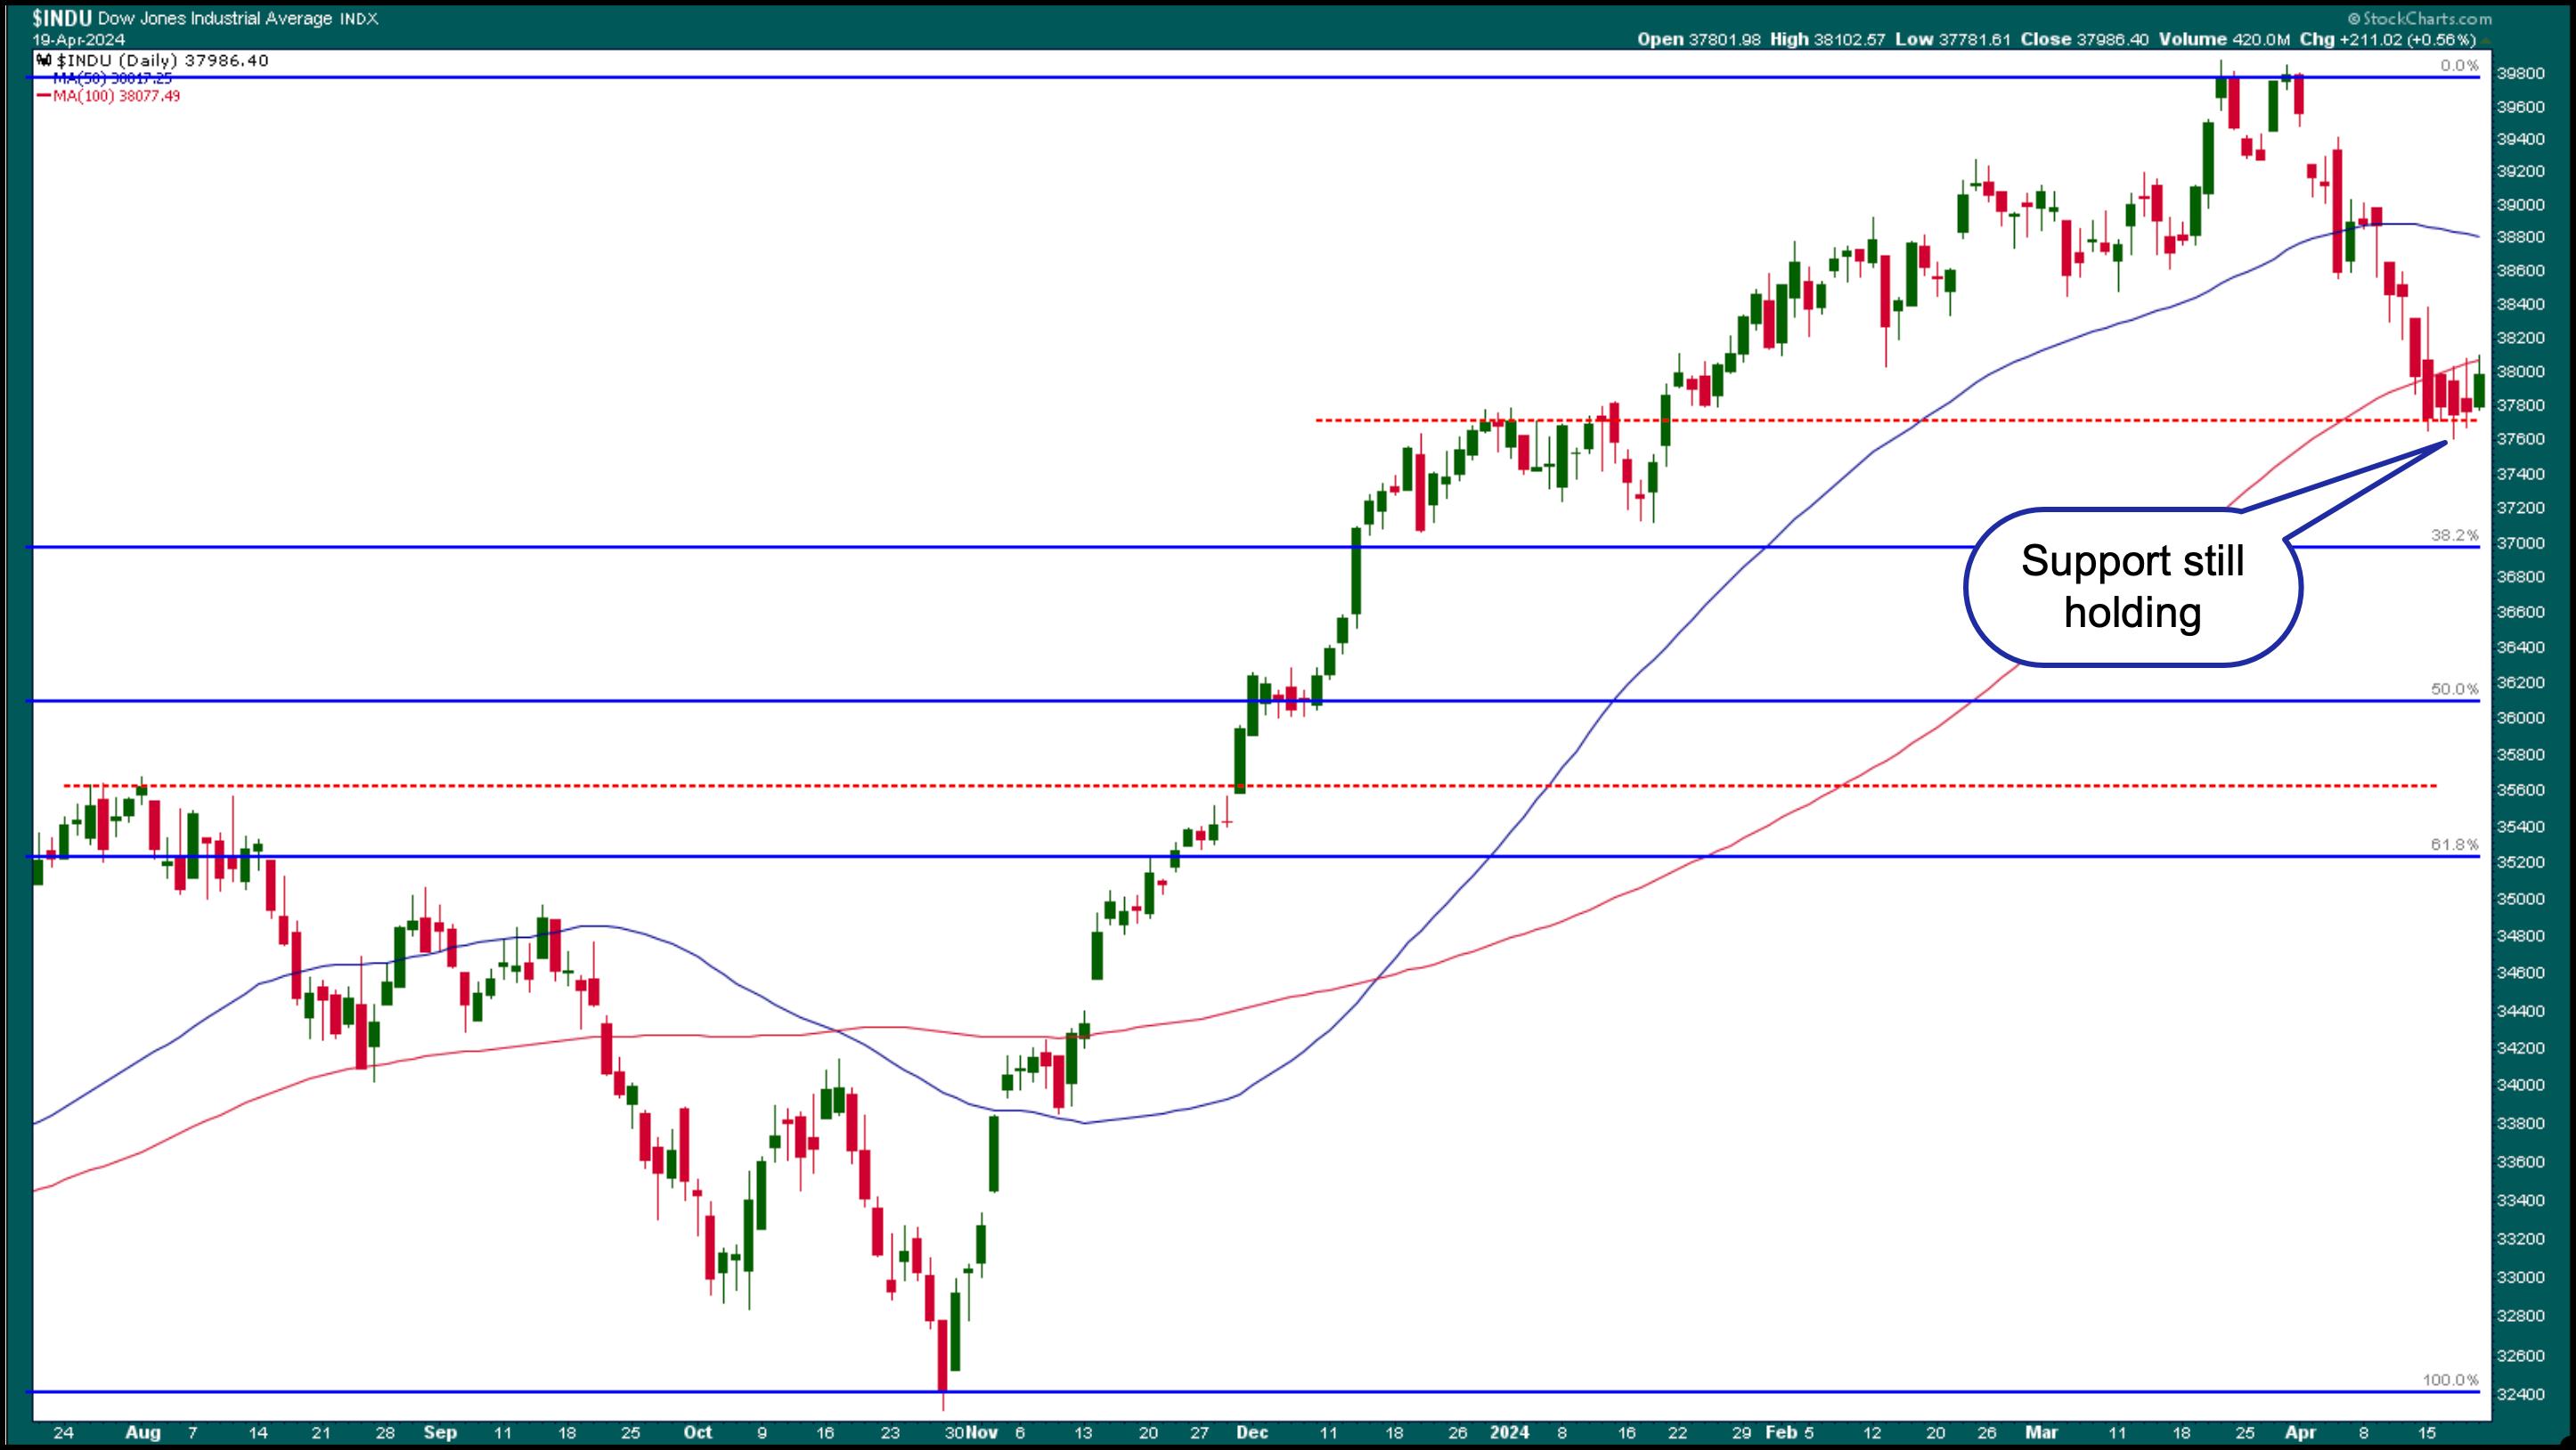
FIGURE 2. DAILY CHART OF DOW JONES INDUSTRIAL AVERAGE ($INDU). After its elevator ride down, $INDU appears to have hit a support level and trying to reverse, which is a positive sign.Chart source: StockCharts.com. For educational purposes.
The Nasdaq Composite
The Technology sector was hit hard this week. NVIDIA (NVDA) fell over 9% on Friday; Tesla (TSLA) shares continued to fall, hitting a new 52-week low; and Advanced Micro Devices (AMD) fell over 5%.
Super Micro Computers (SMCI), which has been in the top 5 StockCharts Technical Rank (SCTR) for months, fell over 23%. The selloff was caused by the company's decision not to preannounce its earnings results as it has in the past.
Looks like investors were taking their Tech stock profits. As a result of the big Tech selloff, the Nasdaq Composite is trading below its 100-day SMA (see chart below).
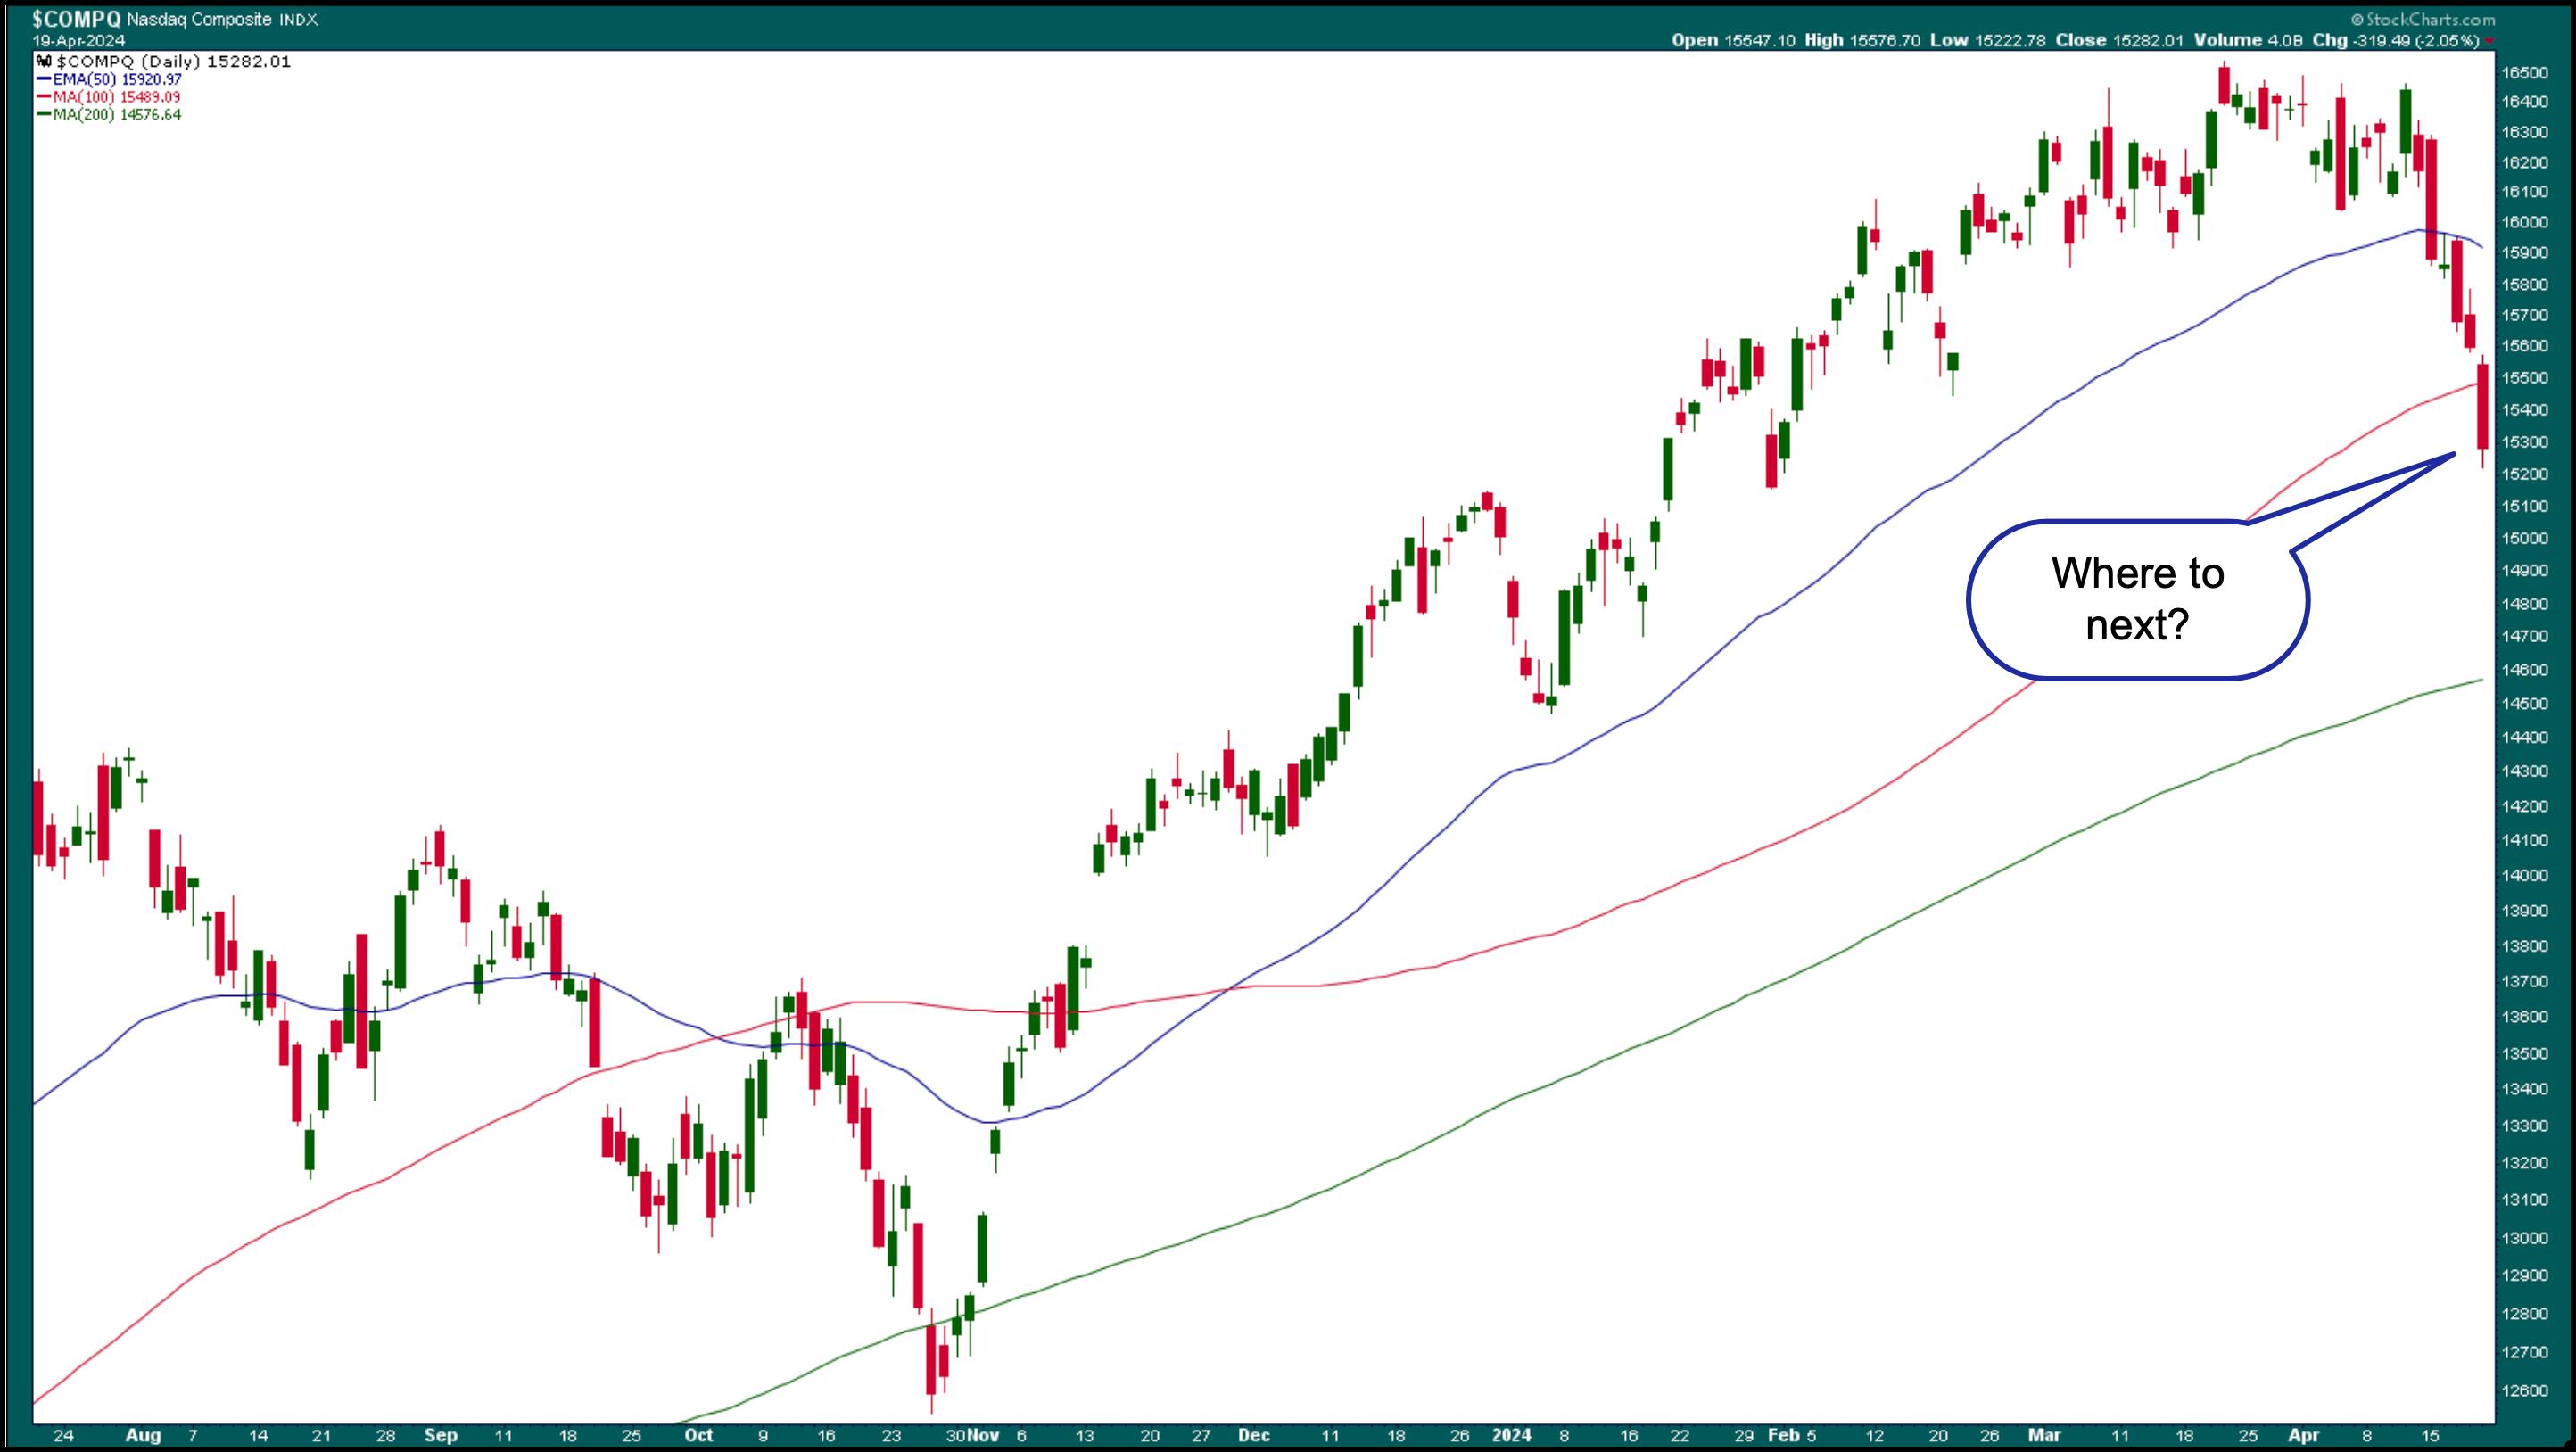
FIGURE 3. DAILY CHART OF NASDAQ COMPOSITE. After falling below its 100-day SMA, the Nasdaq Composite could slide to its 200-day SMA. The small wick at the bottom is slightly encouraging, but next week is another week.Chart source: StockCharts.com. For educational purposes.
Whenever there's a massive selloff, as was the case this week, investors question whether the market has hit a bottom and if it's an ideal time to open long positions. There was a little bit of that on Friday, but every time the market rallied, it met pressure from sellers and the rally fizzled. When technicals still point lower, you may want to adopt a "wait and see" approach before entering long positions.
Nobody knows what will happen next week, but tech companies will start reporting earnings, and that could lift the stock market.
Some Bright Spots
After experiencing a plunge similar to that of the broader indexes, the Financial sector is showing signs of a reversal. The daily chart of the Financial Select Sector SPDR (XLF) below shows a possible reversal, although a series of higher highs and higher lows is needed before an uptrend can be established. XLF would need to break above.
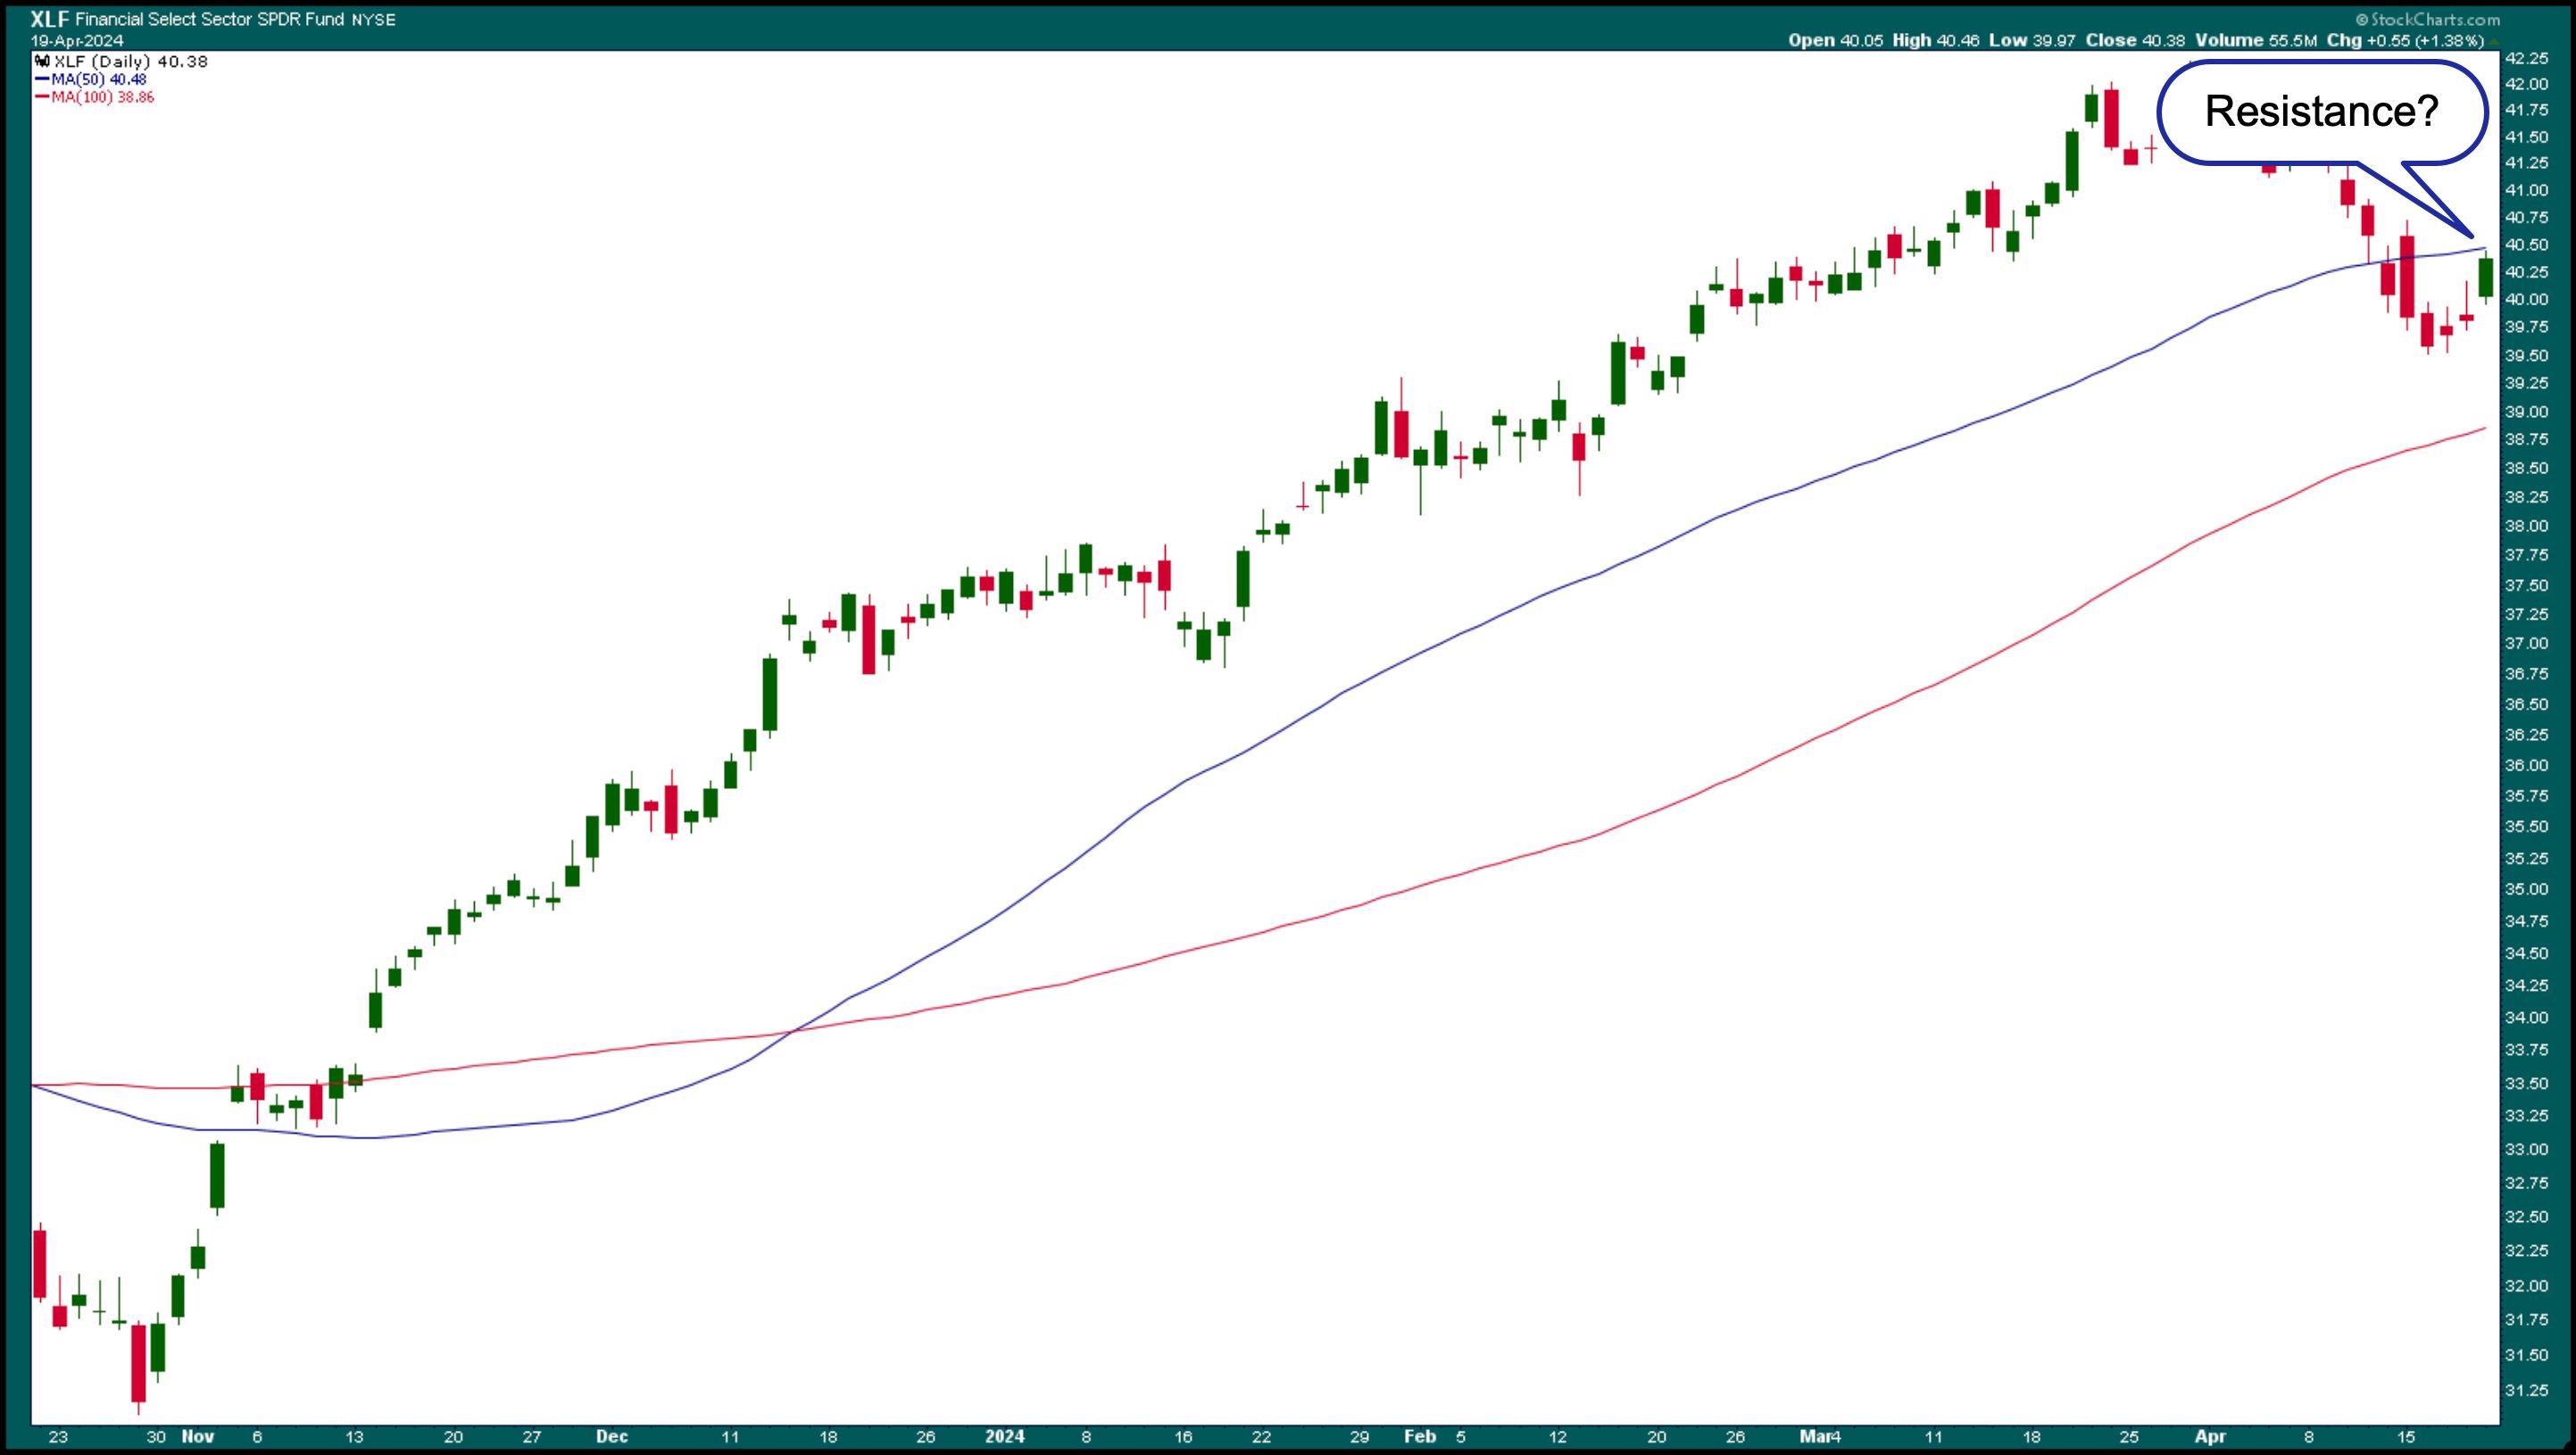
FIGURE 4. DAILY CHART OF FINANCIAL SELECT SECTOR SPDR ETF (XLF). Looks like XLF will have to overcome the resistance from its 50-day moving average before its trend reverses.Chart source: StockCharts.com. For educational purposes.
Shares of Bank of America (BAC), JP Morgan Chase (JPM), Citigroup (C), and Wells Fargo (WFC) all traded higher on Friday. WFC's stock price reached a new all-time high. Precious metals, such as gold and silver, are trading higher. As geopolitical tensions arise, investors turn to these safe-haven investments.
It was interesting to see the CBOE Volatility Index ($VIX) hit a high of 21.36, close to the 23 level it hit in October last year. But it pulled back and closed at 18.71. The higher volatility could have been because of options expiration.
If you look at the chart of the Nasdaq Composite, you'll see that this coincided with the October selloff in Tech stocks. Will the broader markets follow a similar path, given Tech earnings start next week? We'll have to wait and see.
The Bottom Line
This week's stock market action wasn't great, and while it's tempting to find bargains in stocks, it's best to exercise patience. Instead of chasing positions, it's an excellent time to analyze charts and observe the market's actions. This can go a long way in understanding the irrational nature of the stock market.
End-of-Week Wrap-Up

- S&P 500 closes down 0.88% at 4,967.23, Dow Jones Industrial Average up 0.56% at 37,986; Nasdaq Composite down 2.05% at 15,282.01
- $VIX up 3.94% at 18.71
- Best performing sector for the week: Utilities
- Worst performing sector for the week: Technology
- Top 5 Large Cap SCTR stocks: MicroStrategy Inc. (MSTR); Coinbase Global Inc. (COIN); Super Micro Computer, Inc. (SMCI); Vistra Energy Corp. (VST); Vertiv Holdings (VRT)
On the Radar Next Week
- Q1 2024 US GDP
- March Core PCE
- March Durable Goods Orders
- Earnings season is in full swing with Alphabet (GOOGL), Meta Platforms (META), Tesla (TSLA), Microsoft (MSFT), Intel Corp. (INTC), and Visa (V) reporting.
Disclaimer: This blog is for educational purposes only and should not be construed as financial advice. The ideas and strategies should never be used without first assessing your own personal and financial situation, or without consulting a financial professional.
Happy charting!


