TAKEAWAYS
- The stock market started out slow, sold off, and then recovered some of those losses to end the week on an optimistic note.
- Market internals continue to be strong indicating that the stock market has a bullish bias.
- Several stocks made new highs including NVDA, FSLR, and DELL.

It was a roller-coaster week in the stock market, a reminder that, when markets are trading at their all-time highs, it pays to be cautious. Any negative news can trigger emotions, resulting in a domino effect reaction.
In the early part of the week, the stock market was pretty lethargic, with investors waiting for Nvidia's earnings. When NVDA earnings were announced after the close on Wednesday, the stock price soared in after-hours trading. The upside move continued when the market opened on Thursday, with the stock price closing at a record high on Friday.
However, despite NVDAs' rally, the rest of the market threw some surprises. On Thursday, there was a significant selloff, which threw many investors off. The broader equity indexes fell, as did precious metals.
The May Purchasers Manufacturing Index (PMI) came in higher than expected, which may have reminded investors that the strong economy could mean higher rates for longer. The FOMC minutes this week suggested that Fed members aren't confident that inflation has come down enough to warrant rate cuts any time soon.
On Friday, the S&P 500 ($SPX) and Nasdaq Composite ($COMPQ) recovered some of Thursday's losses. This was a surprise; you'd think the selloff would continue ahead of the Memorial Day weekend.
Follow the live chart!

Another interesting area is the price action in US Treasury yields, which seem to. be going through a consolidation pattern. Until they break out of this pattern, there's no telling which way yields will go. The Fed is committed to bring inflation to 2%, but we don't know how long it'll take to get there.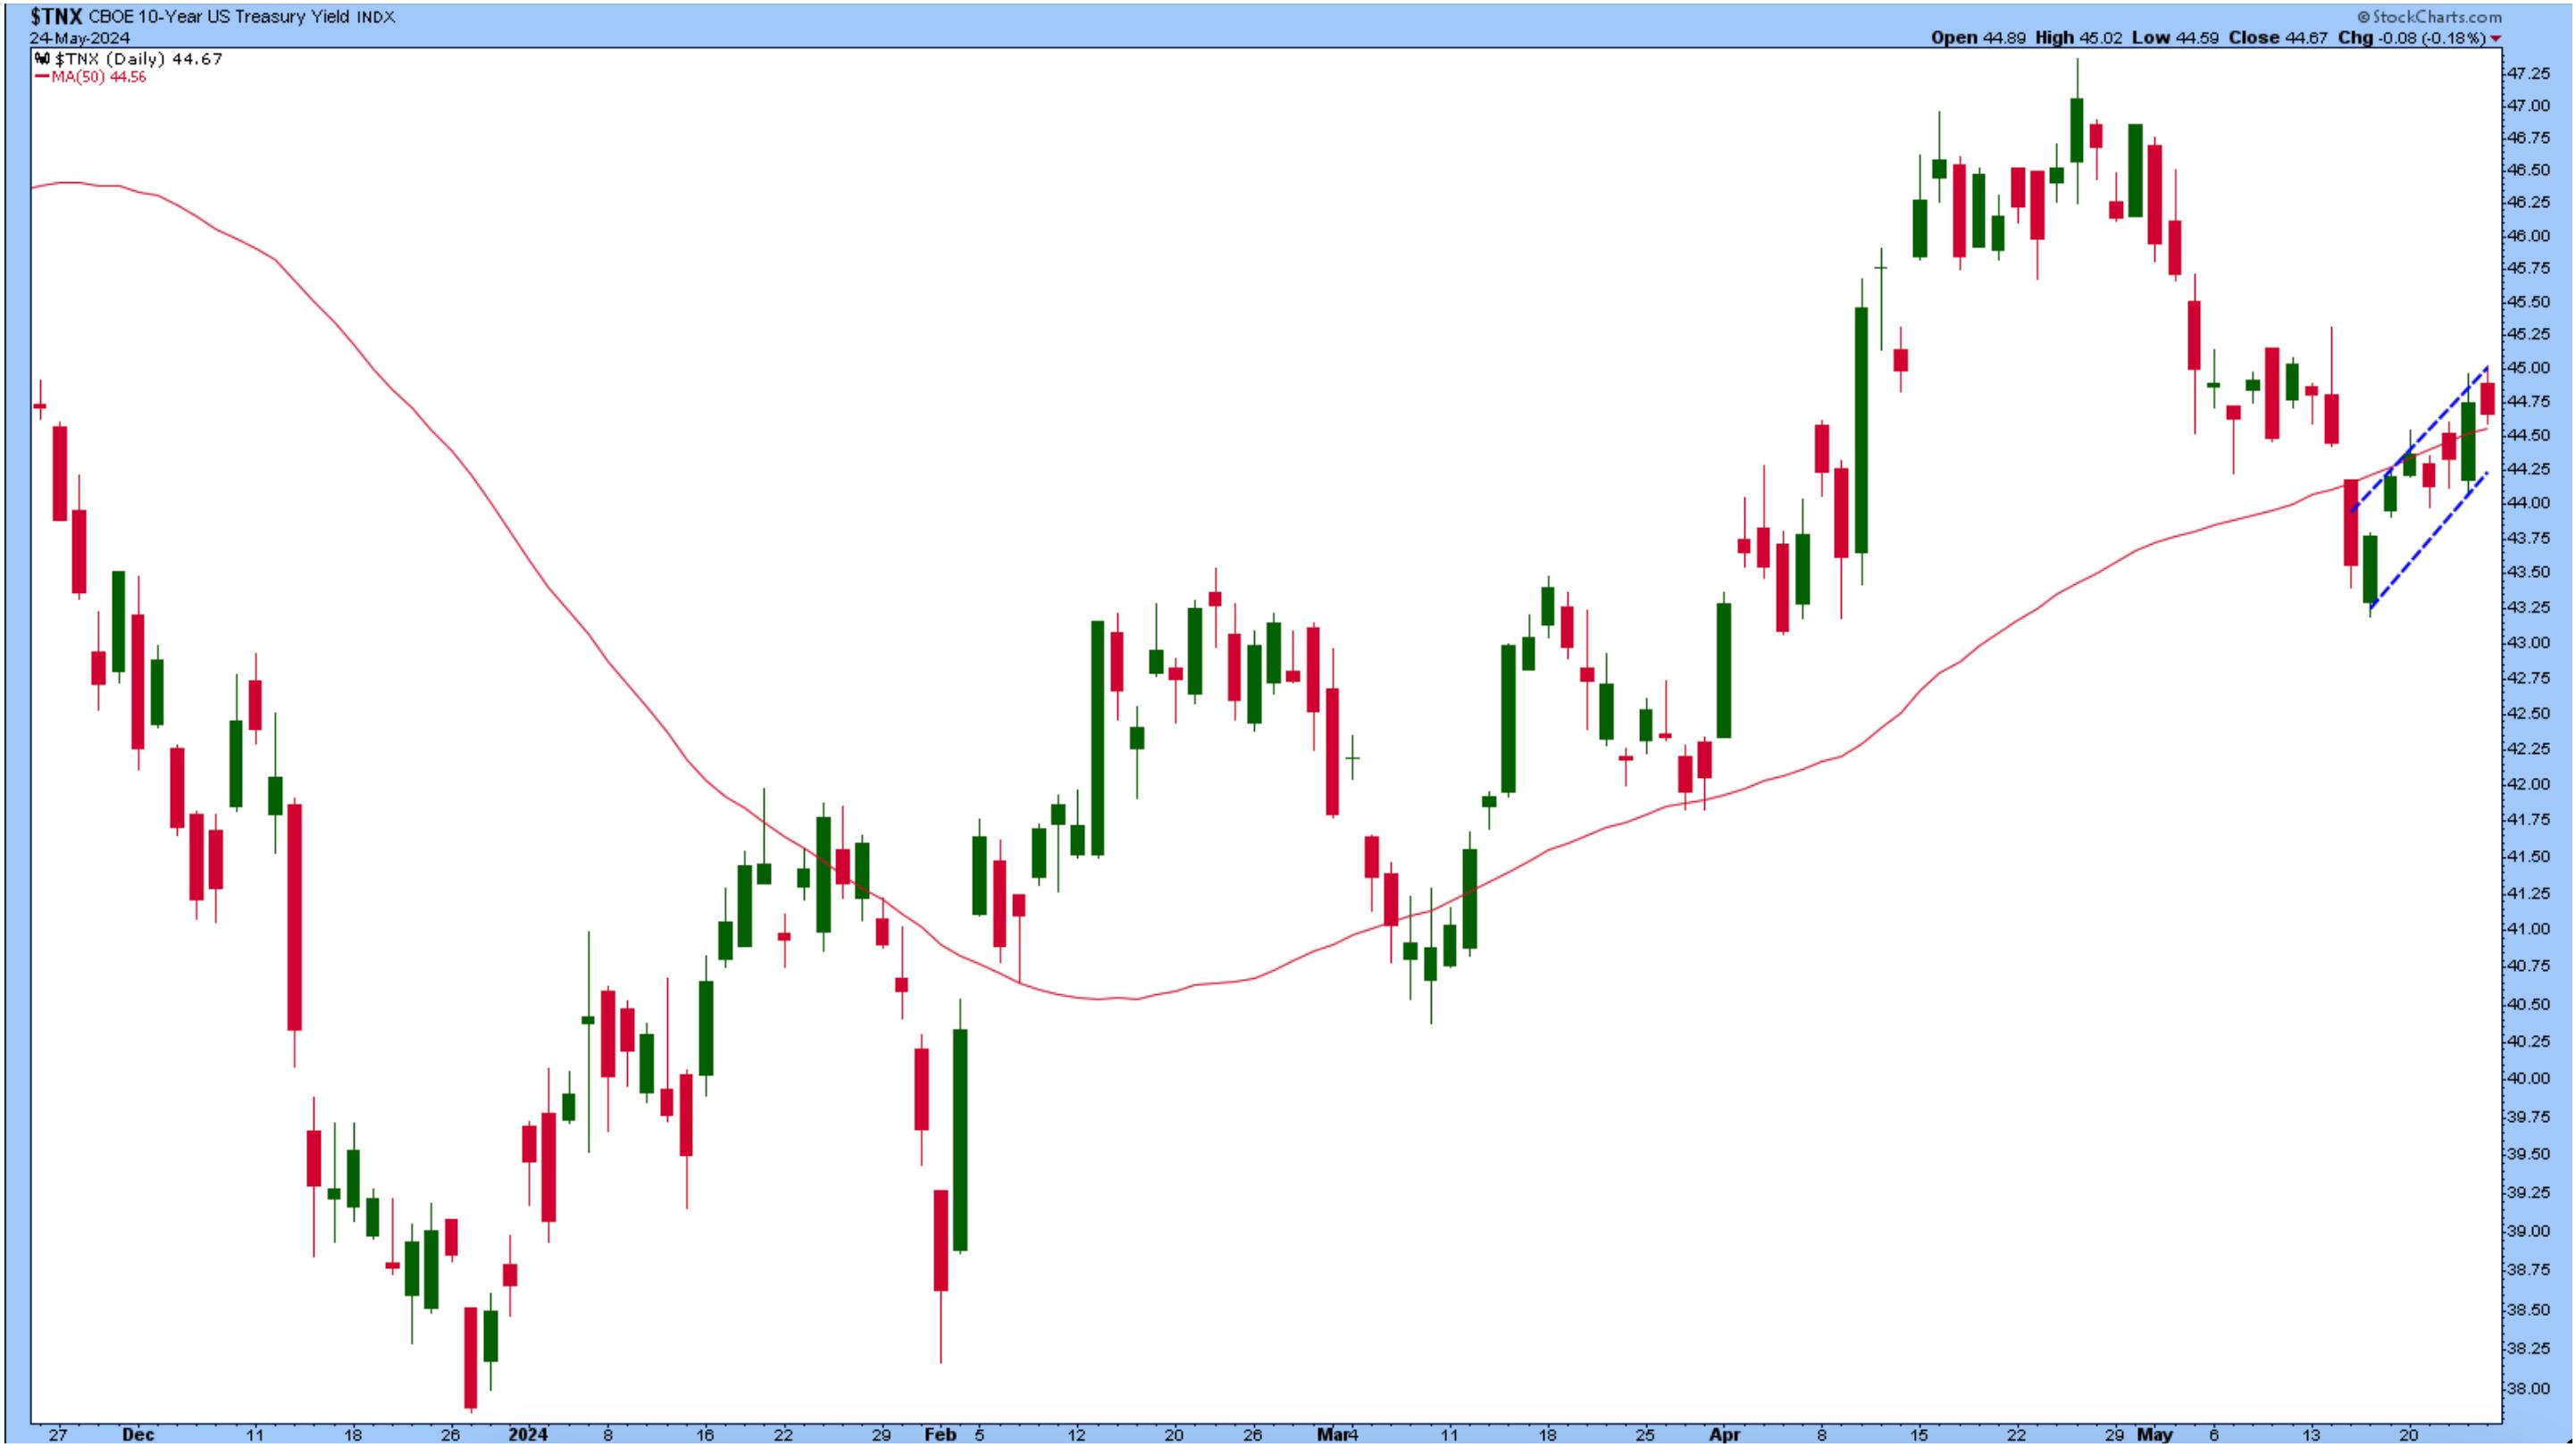
CHART 1. 10-YEAR US TREASURY YIELDS IN CONSOLIDATION. Yields could break out in either direction. A lot depends on future economic data points. Chart source: StockCharts.com. For educational purposes.
A comforting thought is that the CBOE Volatility Index ($VIX) is low, indicating that investors aren't fearful. This supports a bull market thesis. It's challenging to forecast which direction the stock market will move, and we could see continued sideways movement for a while, especially after the FOMC minutes.
You can sense the presence of investor enthusiasm as stocks continue to reach all-time highs. Over 100 stocks hit an all-time high (check out the New All-Time Highs Predefined StockCharts scan). The New Highs-New Lows index ($NYHL) also shows more new highs than lows, although the number of new highs is not as high as it was in recent weeks (see chart below).
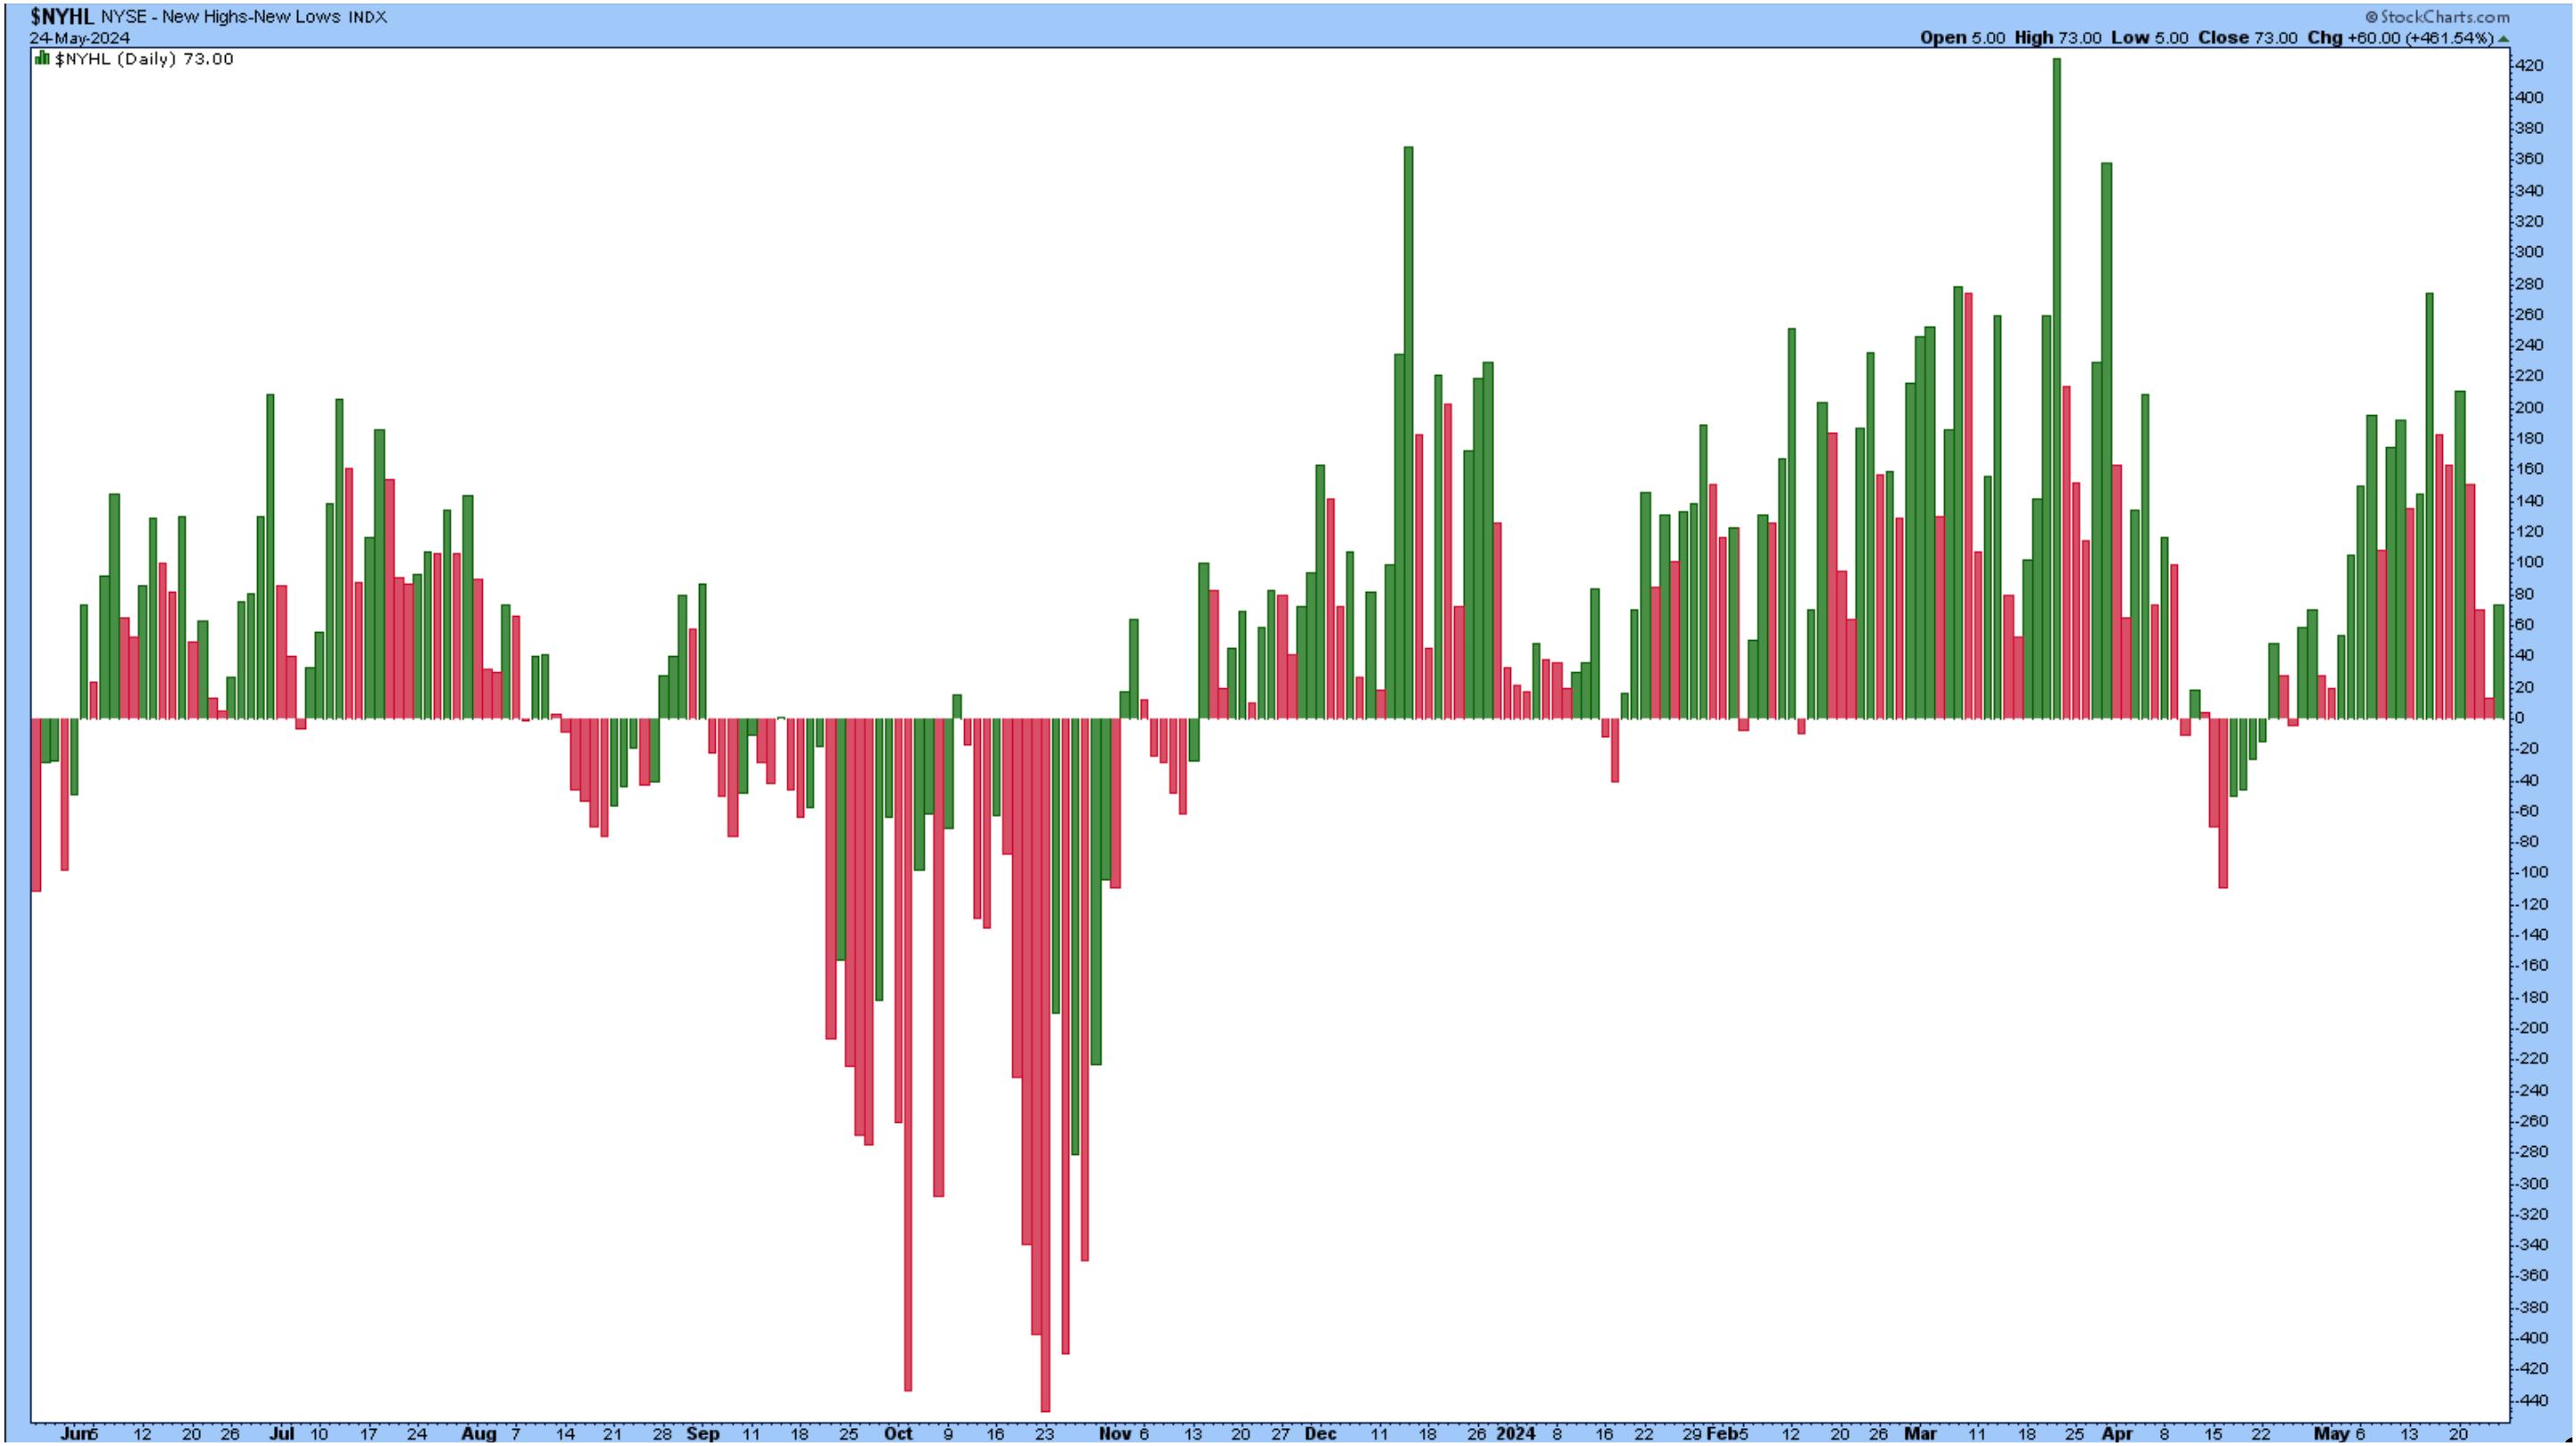
CHART 2. NEW HIGHS - NEW LOWS. The number of new highs is greater than the number of new lows. Chart source: StockCharts.com. For educational purposes.
A Few Stocks to Note
Follow the live chart!

Look at how First Solar (FSLR) performed this week. The stock surged, surpassing its last high of around $230 about a year ago. Despite FSLR's rise, its relative strength compared to the S&P 500 index is at -32.81%. It's got a lot of catching up to do.
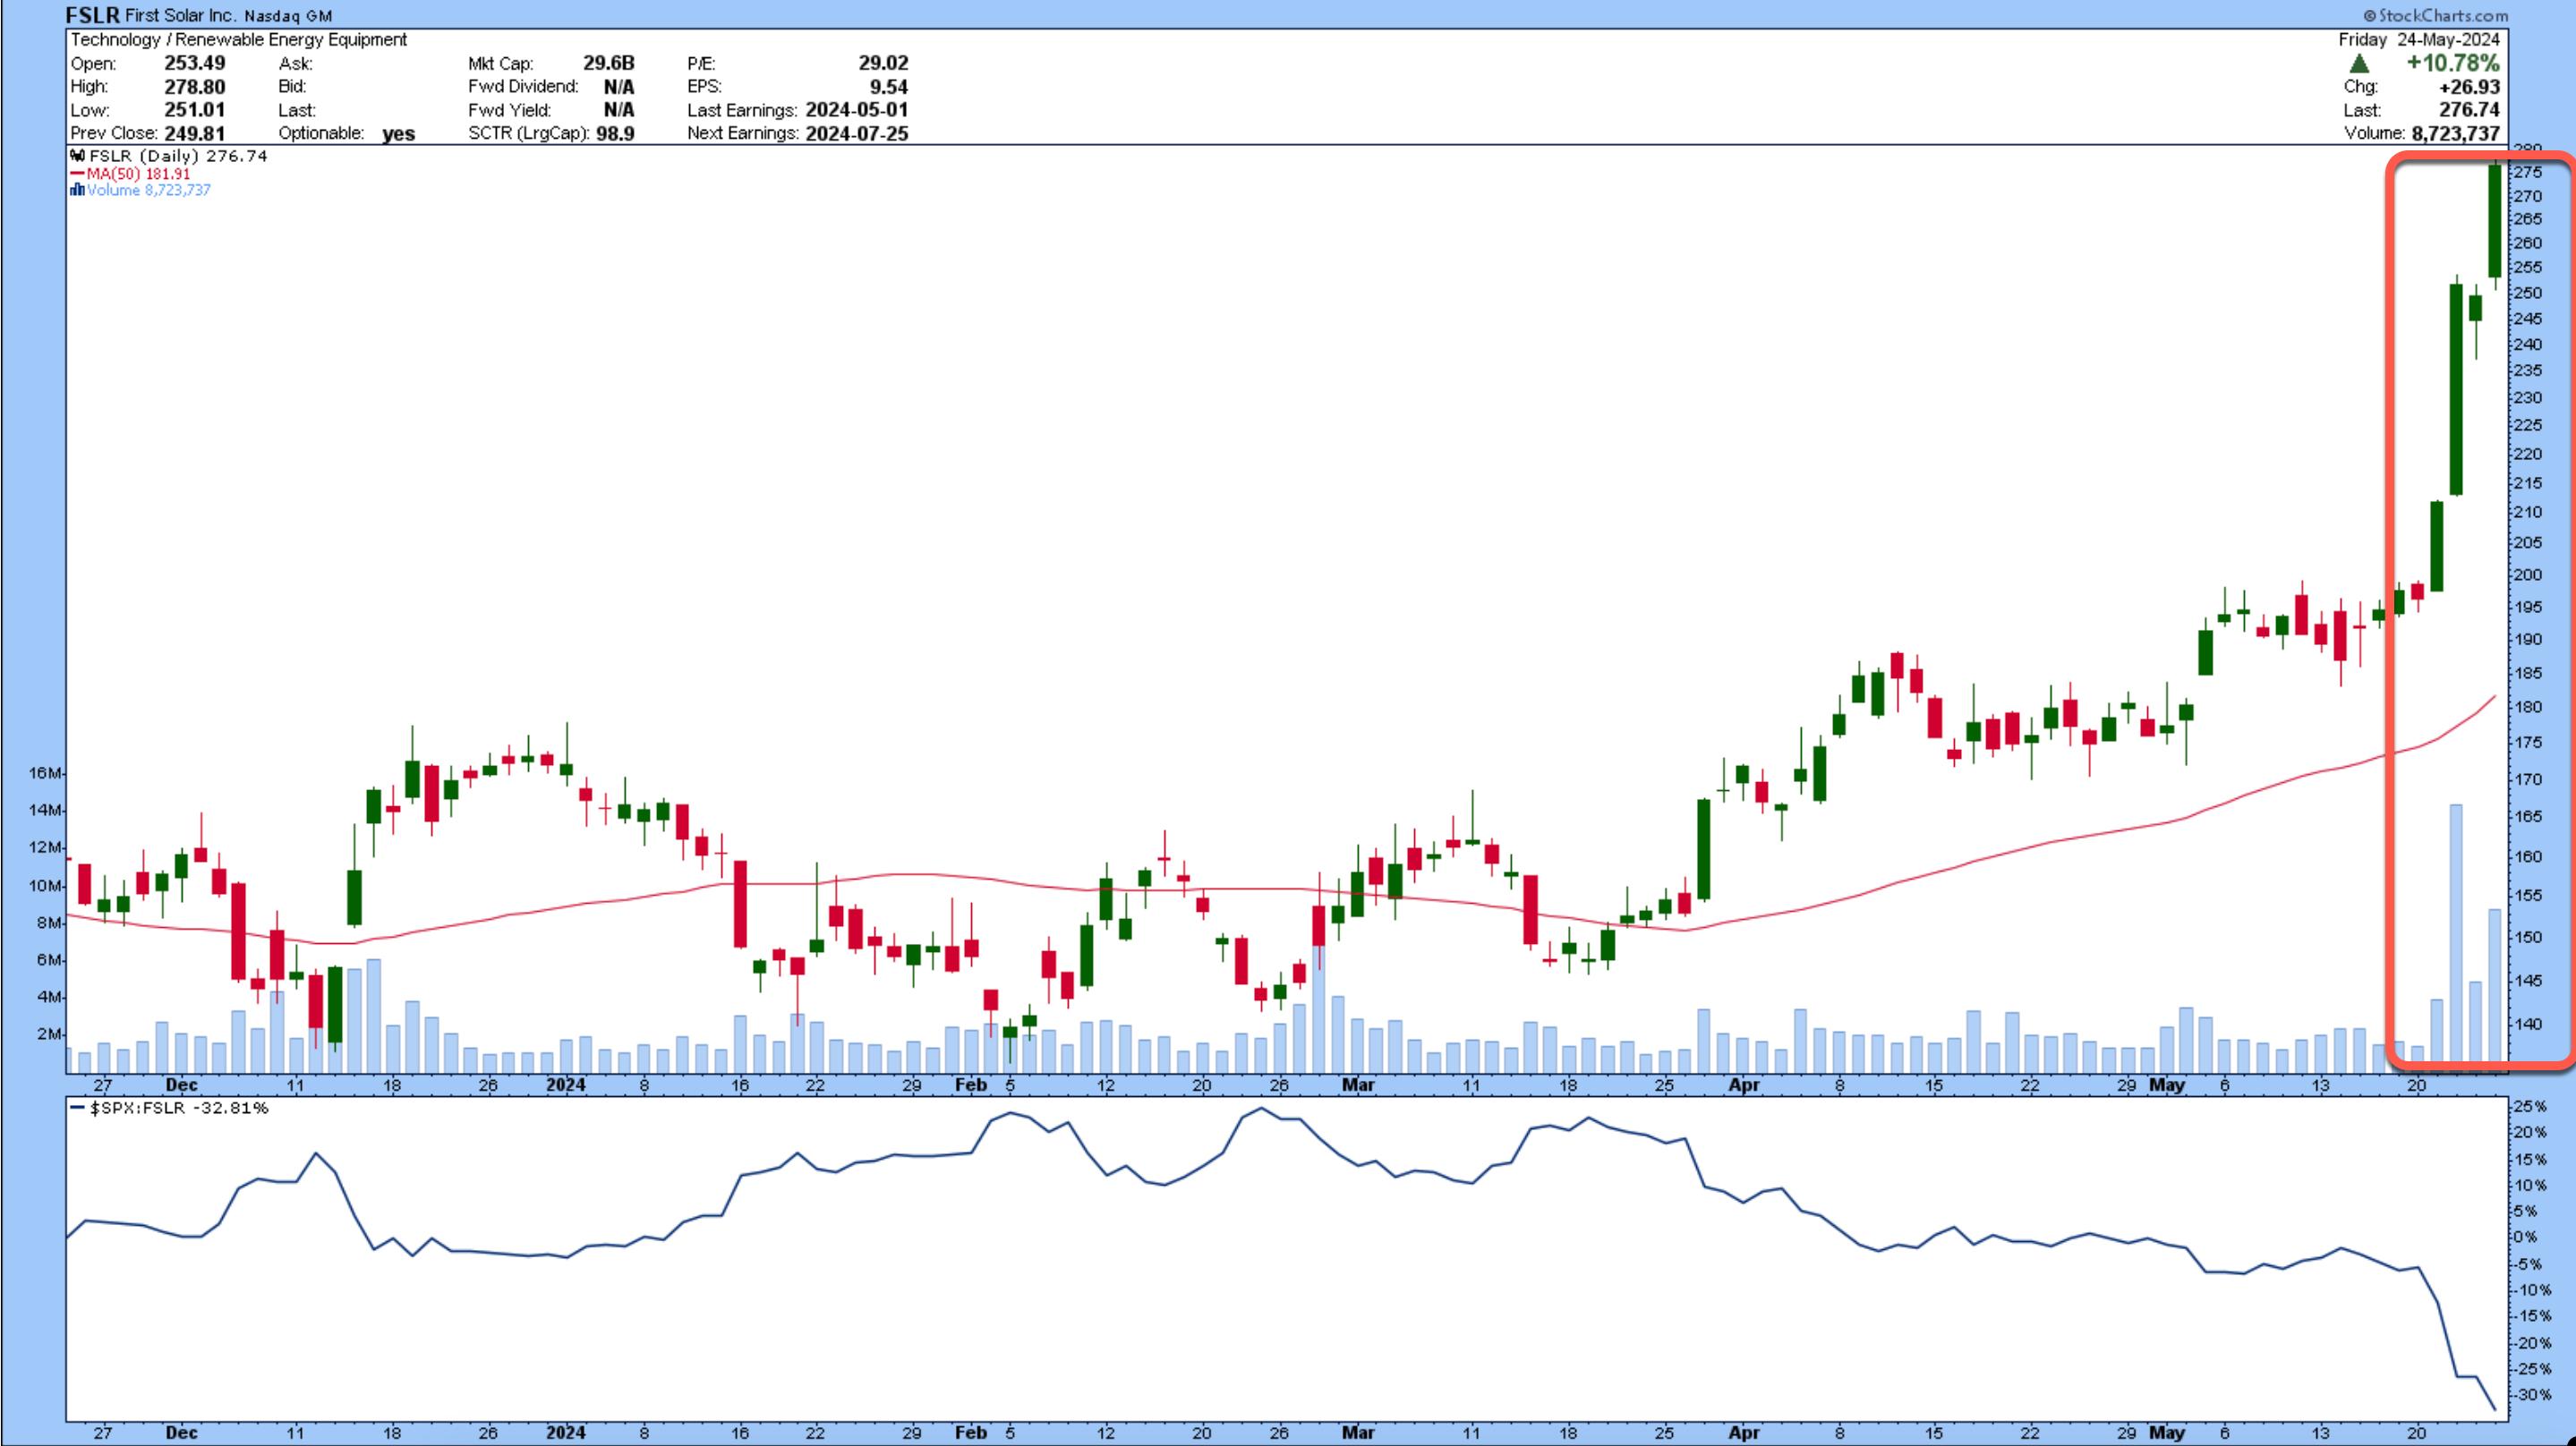
CHART 3. FSLR JUMPS ON THE AI RIDE. The AI infrastructure needs to depend on energy companies and
What makes the stock appealing? FSLR has attracted the attention of analysts as a company that will benefit from the AI revolution. There's a lot of talk about how the increased capacity of data centers will require energy, and FSLR could be one company that would benefit from the increased demand.
FSLR made it to three StockCharts Predefined Scans—New 52-Week Highs, Moved Above Upper Price Channel, P&F Double Top Breakout.
Another stock that hit a new high is Dell Technologies (DELL), again because of its contribution to the AI space. From the daily chart of DELL (see below), the stock is in an upward trend, and its relative strength index (RSI) has just crossed above the 70 level.
Follow the live chart!

The stock also reached the top 5 SCTR stocks (see end-of-week wrap-up below). Will the strength continue? We'll find out when the company announces earnings next week.
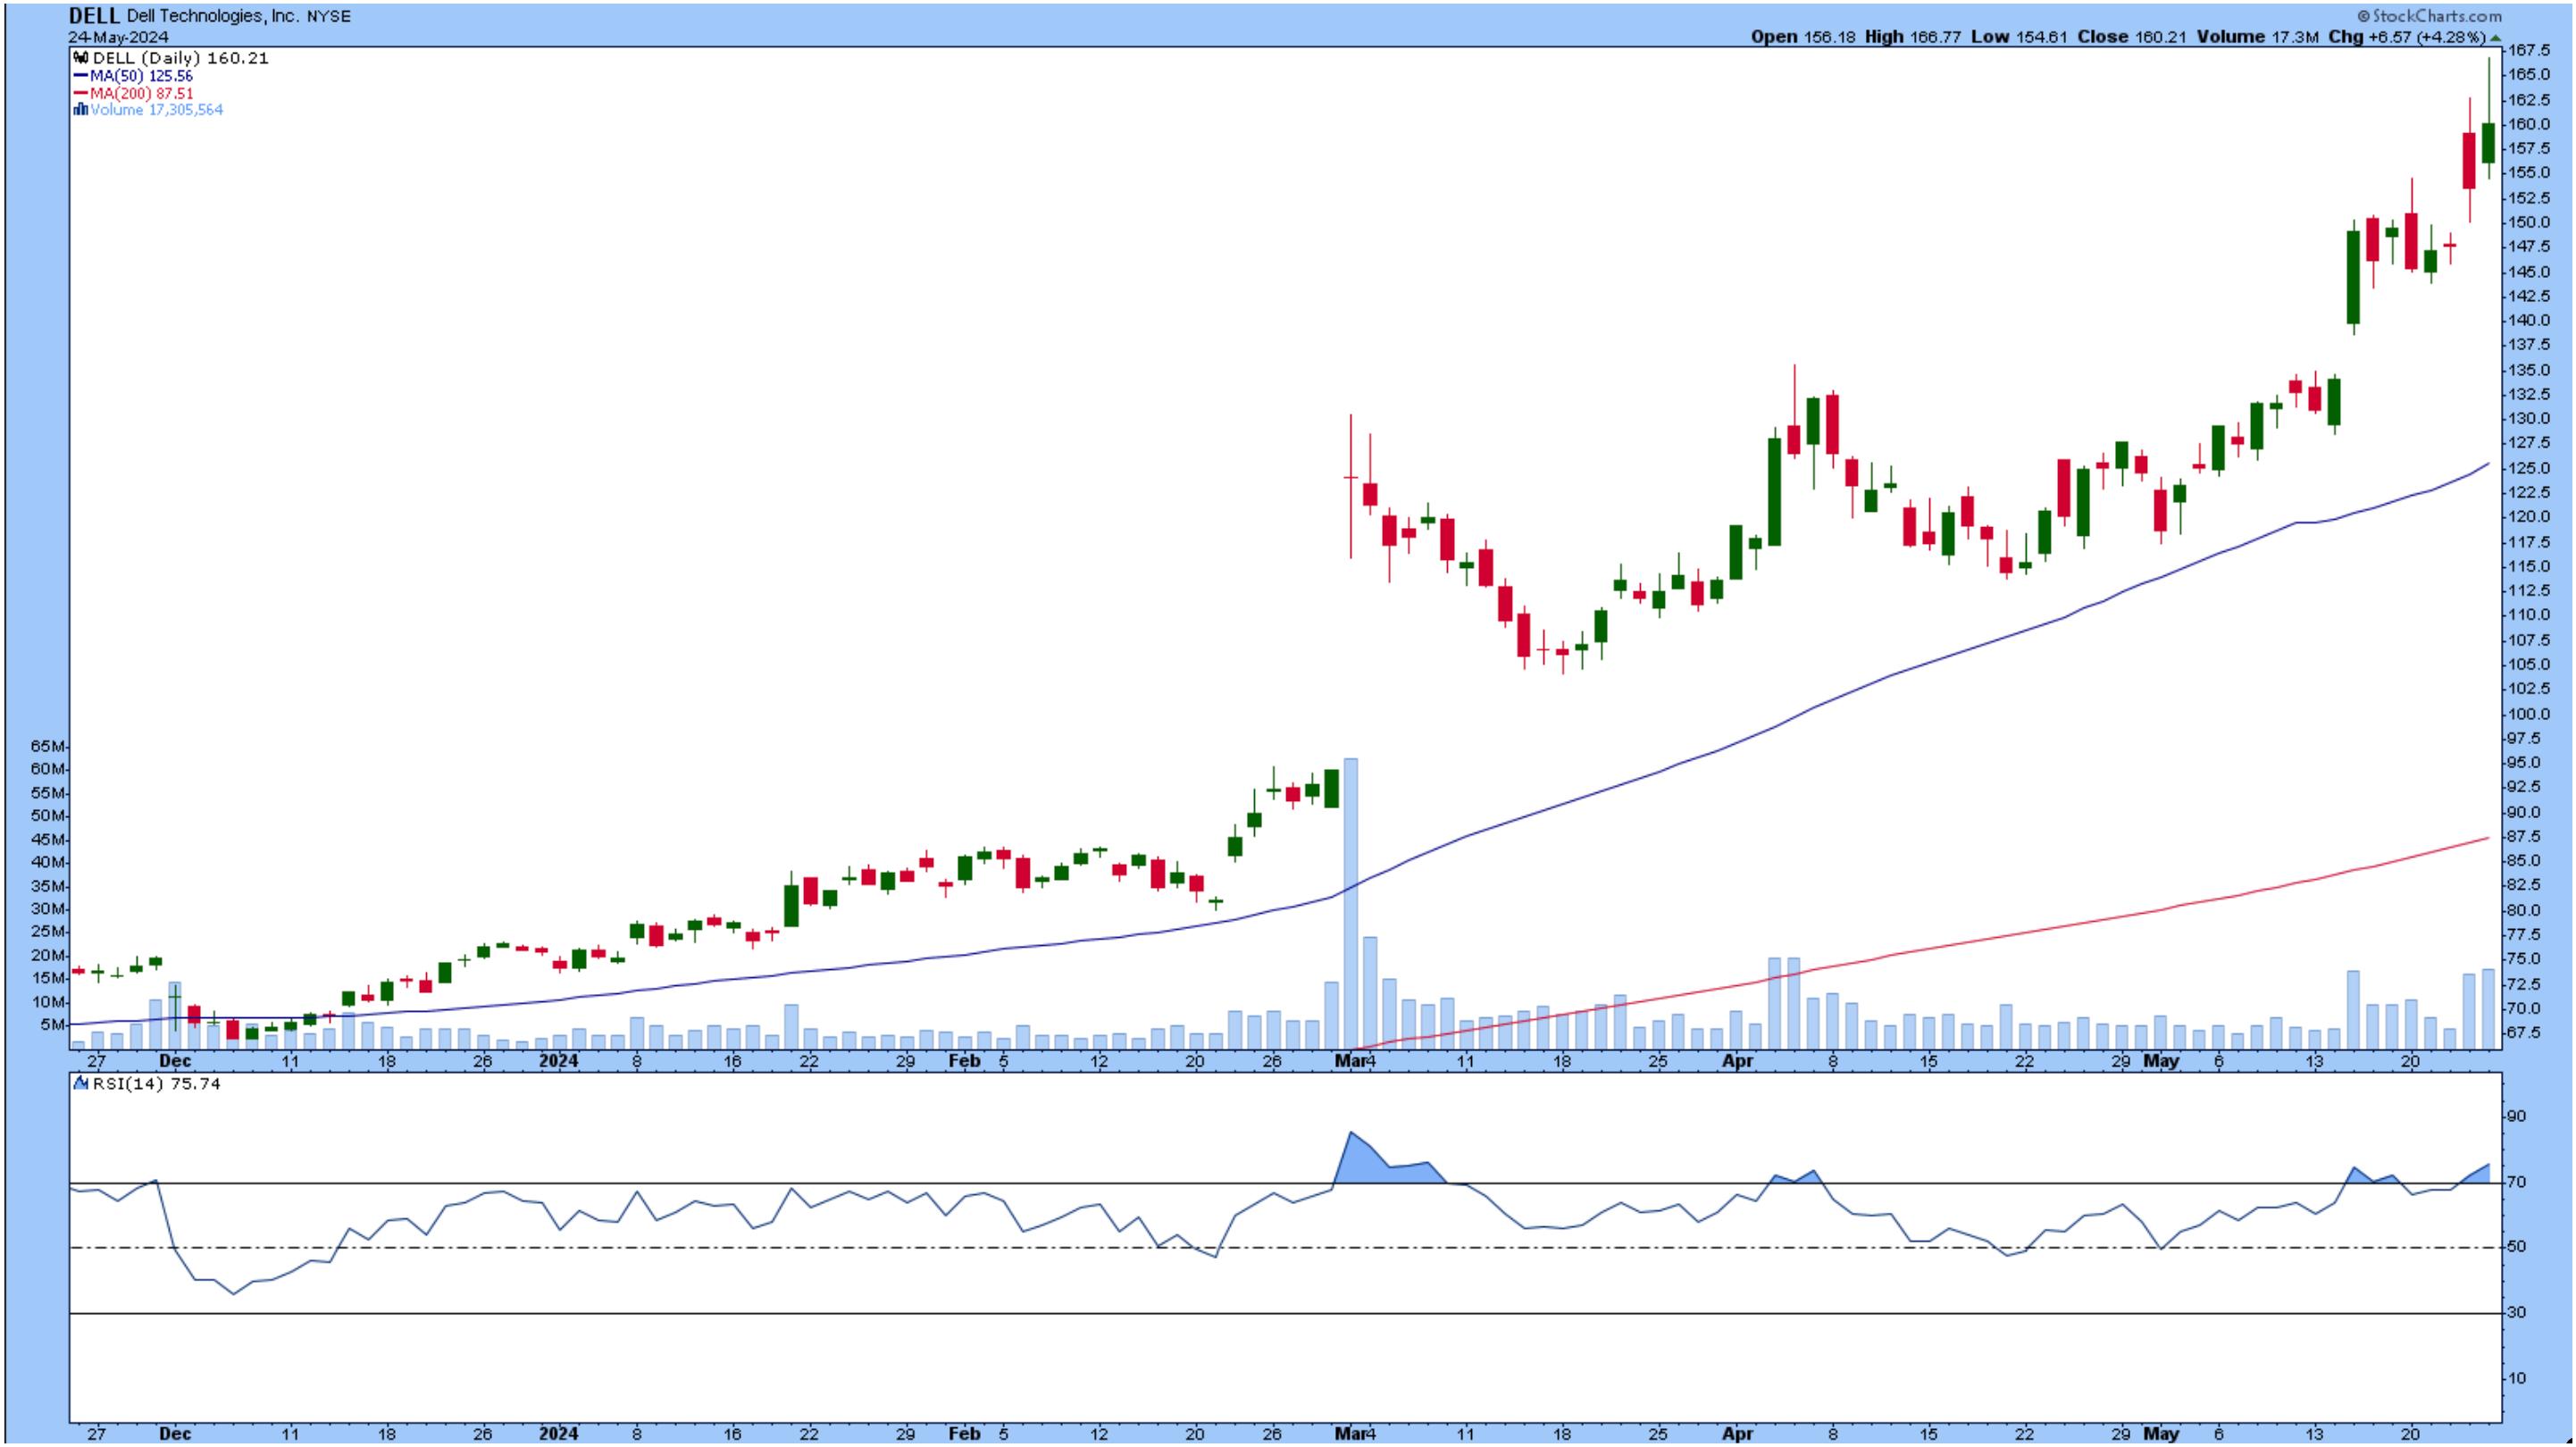
CHART 4. DELL HITS NEW HIGHS. The stock has been gaining strength and is trading well above its 50-day simple moving average. Will earnings push this stock higher? Chart source: StockCharts.com. For educational purposes.
Closing Thoughts
With NVDA earnings in the rearview mirror, could FSLR or DELL be the next stock investors will get excited about? You can't rule it out. This market hits you with surprises, so be prepared for anything. Even though the market went through its ups and downs this week, the overall sentiment appears to be bullish, a good way to start the holiday weekend.
End-of-Week Wrap-Up

- S&P 500 closes up at 5,304.72, Dow Jones Industrial Average up 0.01% at 39,069.59; Nasdaq Composite up 1.1% at 16,920.79
- $VIX down 6.66% at 11.92
- Best performing sector for the week: Technology
- Worst performing sector for the week: Energy
- Top 5 Large Cap SCTR stocks: MicroStrategy Inc. (MSTR); Vistra Energy Corp. (VST); Super Micro Computer, Inc. (SMCI); Vertiv Holdings (VRT); Dell Technologies (DELL)
On the Radar Next Week
- Earnings from Salesforce (CRM), Abercrombie and Fitch (ANF), Dell Technologies (DELL).
- March Home Prices
- Consumer Confidence
- April PCE
- Fed speeches
Disclaimer: This blog is for educational purposes only and should not be construed as financial advice. The ideas and strategies should never be used without first assessing your own personal and financial situation, or without consulting a financial professional.
Happy charting!


