TAKEAWAYS
- Cooler inflation data sees Treasury yields fall and bond prices rise
- The S&P 500 and Nasdaq Composite hit new highs as interest rate cuts could be on the horizon
- AAPL overcomes headwinds and is playing catchup while TSLA awaits results of a shareholder vote to approve its CEO's pay package

Well, the awaited CPI came in cooler than expected. The stock market liked what it heard, and equities rallied. So did bond prices. Later in the day, the Fed announced its interest rate decision, which, as expected, was unchanged.
More importantly, the Fed's Summary of Economic Projections implies a quarter percentage point rate cut this year. The stock market has priced in more than one rate cut in 2024, yet the broader equity indexes didn't react much to this news.
Thursday's lower-than-expected PPI and an uptick in weekly jobless claims may have added more optimism for equities. Both support the interest rate cut narrative. The S&P 500 ($SPX) and Nasdaq Composite ($COMPQ) closed at new highs.
It doesn't seem like there's much that will come in the way of the market's path to pushing higher. Pullbacks have been mild, the CBOE Volatility Index ($VIX) is low, and the AI frenzy continues. There's no reason to start cutting rates when the going is good. Looking at past interest rate cycles, you'll see that interest rate cuts happen when an economy slows down; so far, we're not seeing any signs of that happening.
Bond Bonanza
The price action in bonds has been interesting. As Treasury yields decline, bond prices rise. The daily chart of the iShares 20+ Year Treasury Bond ETF (TLT) below broke above the downward-sloping blue dashed trendline on June 3. The next day, TLT broke above its previous high (May 16) of around $92. A few days later, TLT pulled back, but still stayed above the downward-sloping trendline.
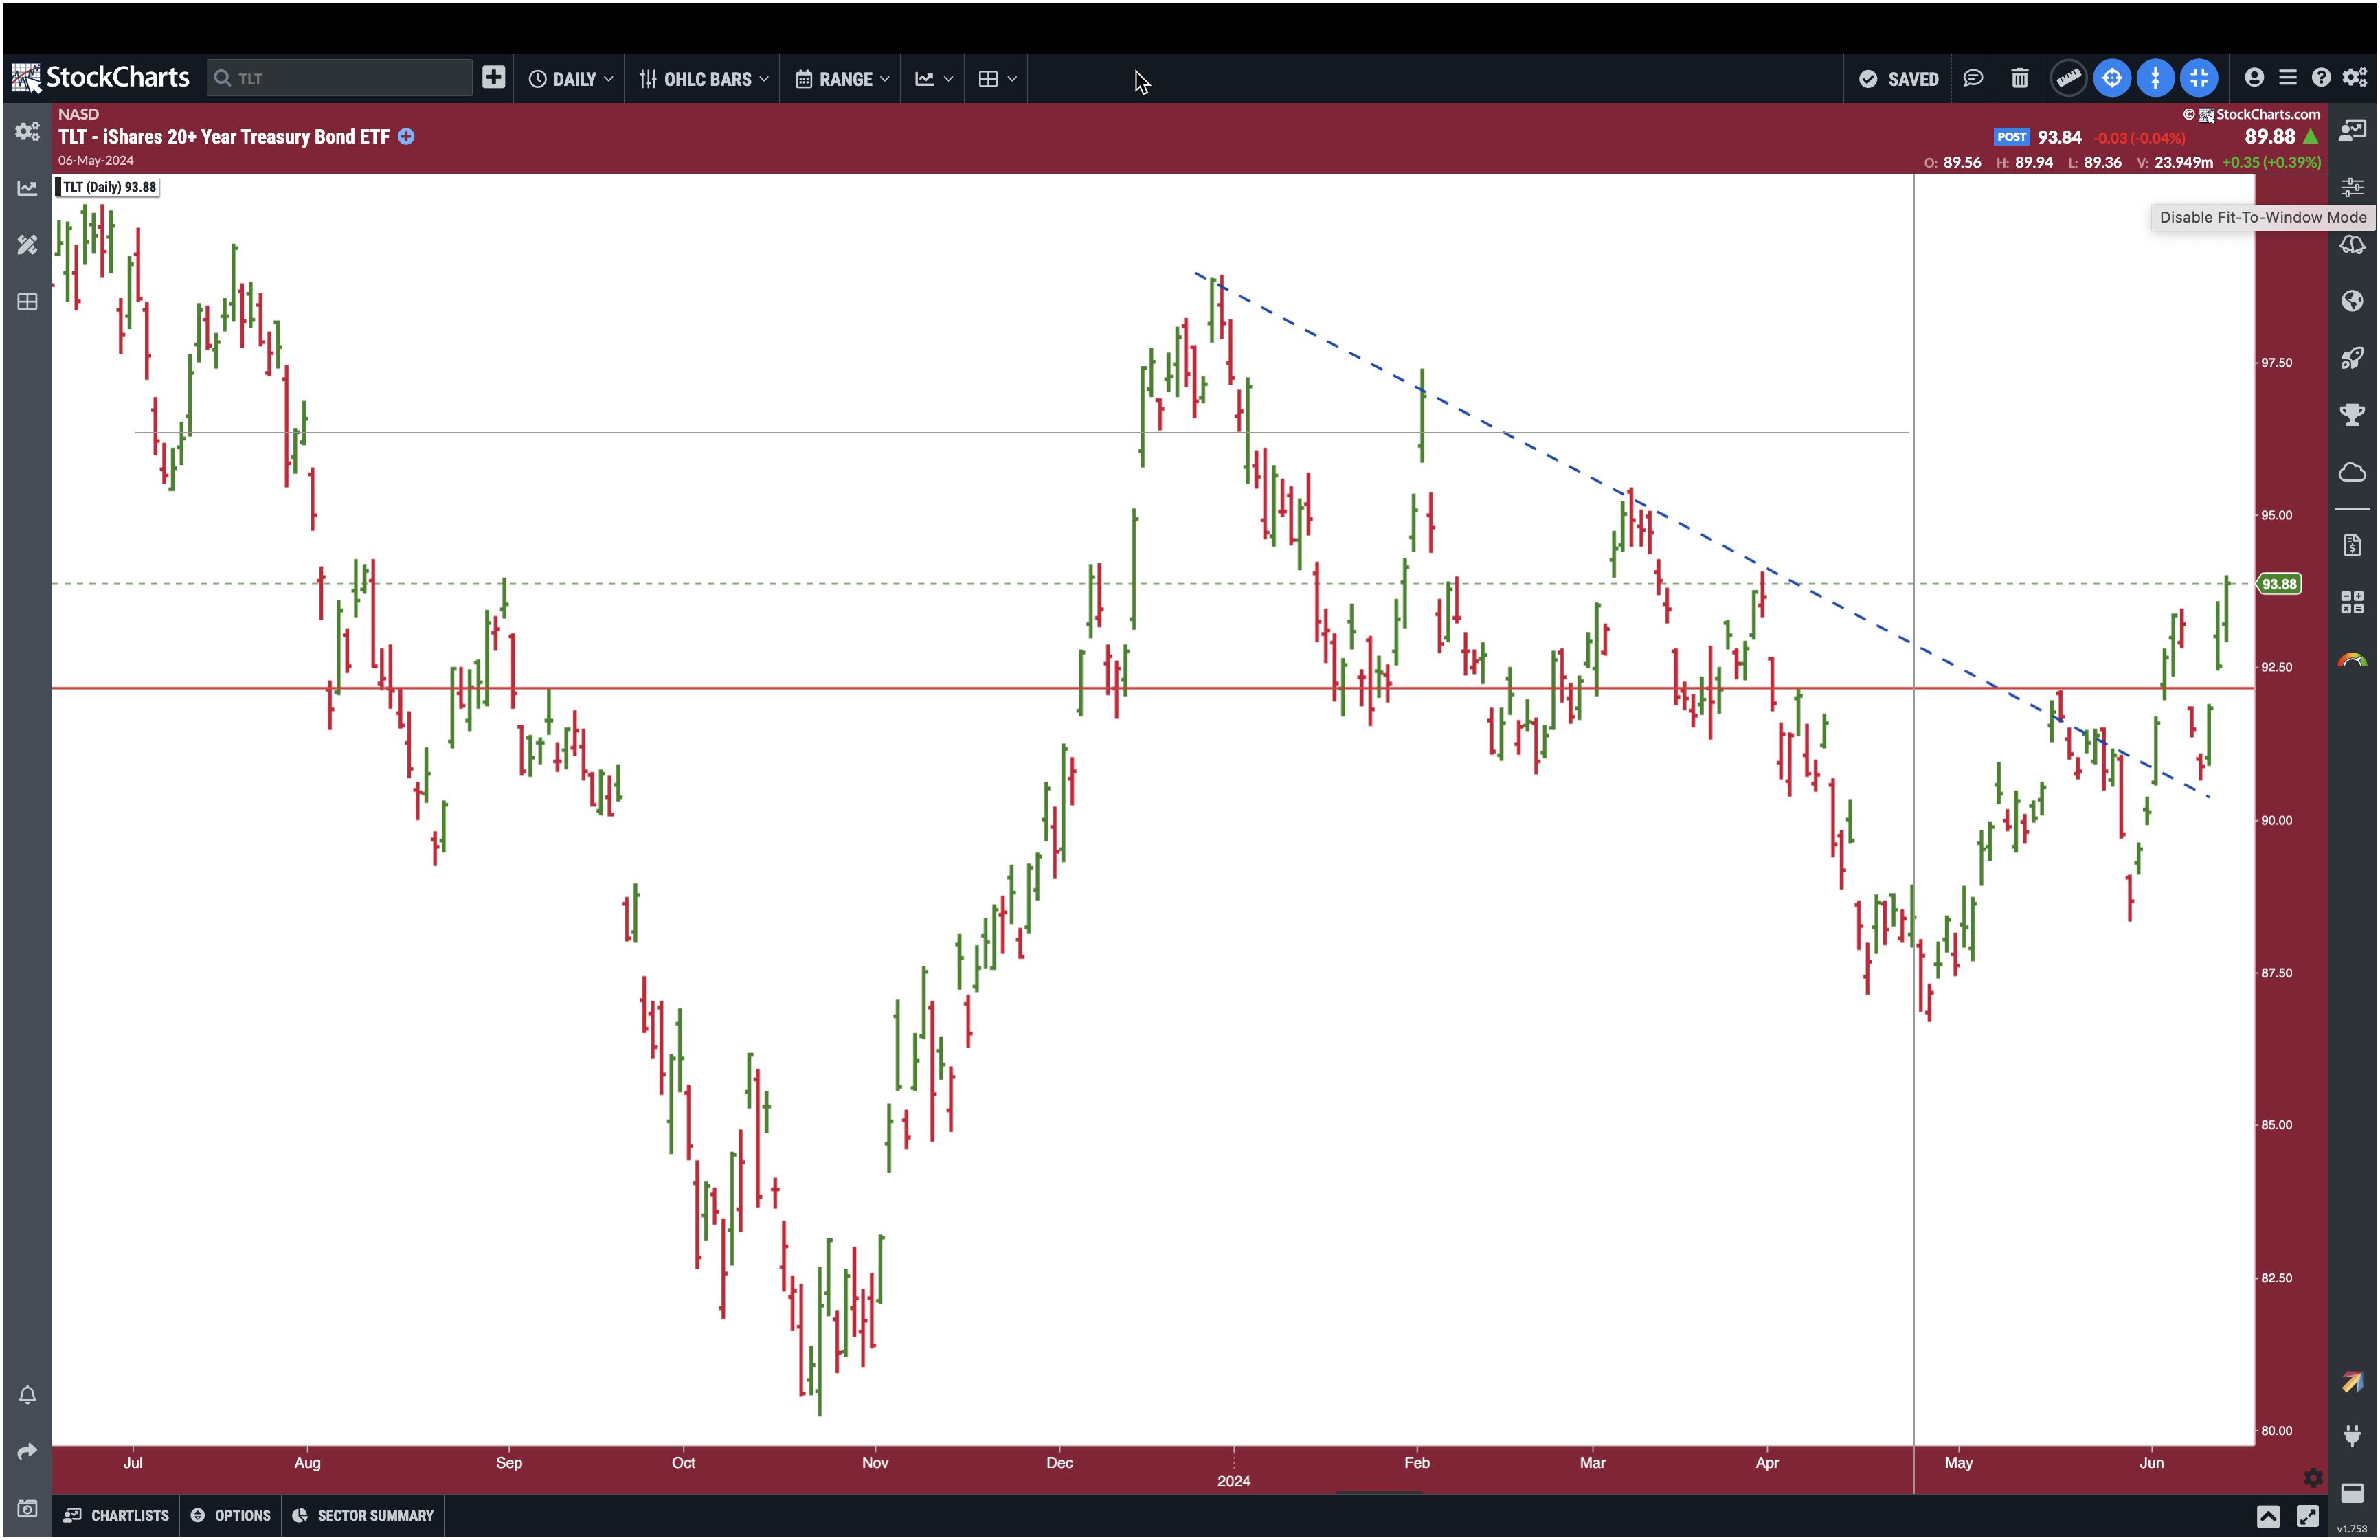
CHART 1. DAILY CHART OF TLT. The ETF broke above its downward-sloping trendline and above its previous May high.Chart source: StockChartsACP. For educational purposes.
After Wednesday's double-whammy economic data day, TLT has continued higher. Thursday's price action is pretty convincing that bonds may have started their climb higher. Does it mean it's time to jump into bonds? The price action in TLT may have to do with the successful 30-year bond auction, so it's best to wait and see what happens in the next couple of days.
What's Up With AAPL and TSLA?
Circling back to the equities space, there's been some interesting activity in specific stocks. Apple, Inc. (AAPL) saw its stock price soar on news of its AI partnership. After a pretty disappointing past few years, AAPL is now back in the spotlight.
The weekly chart of AAPL shows how the stock price traded within a consolidating channel in 2022, broke above that channel in 2023, and then traded sideways for most of 2023 and 2024, until this week. The stock broke above its December 2023 high and hit new highs.
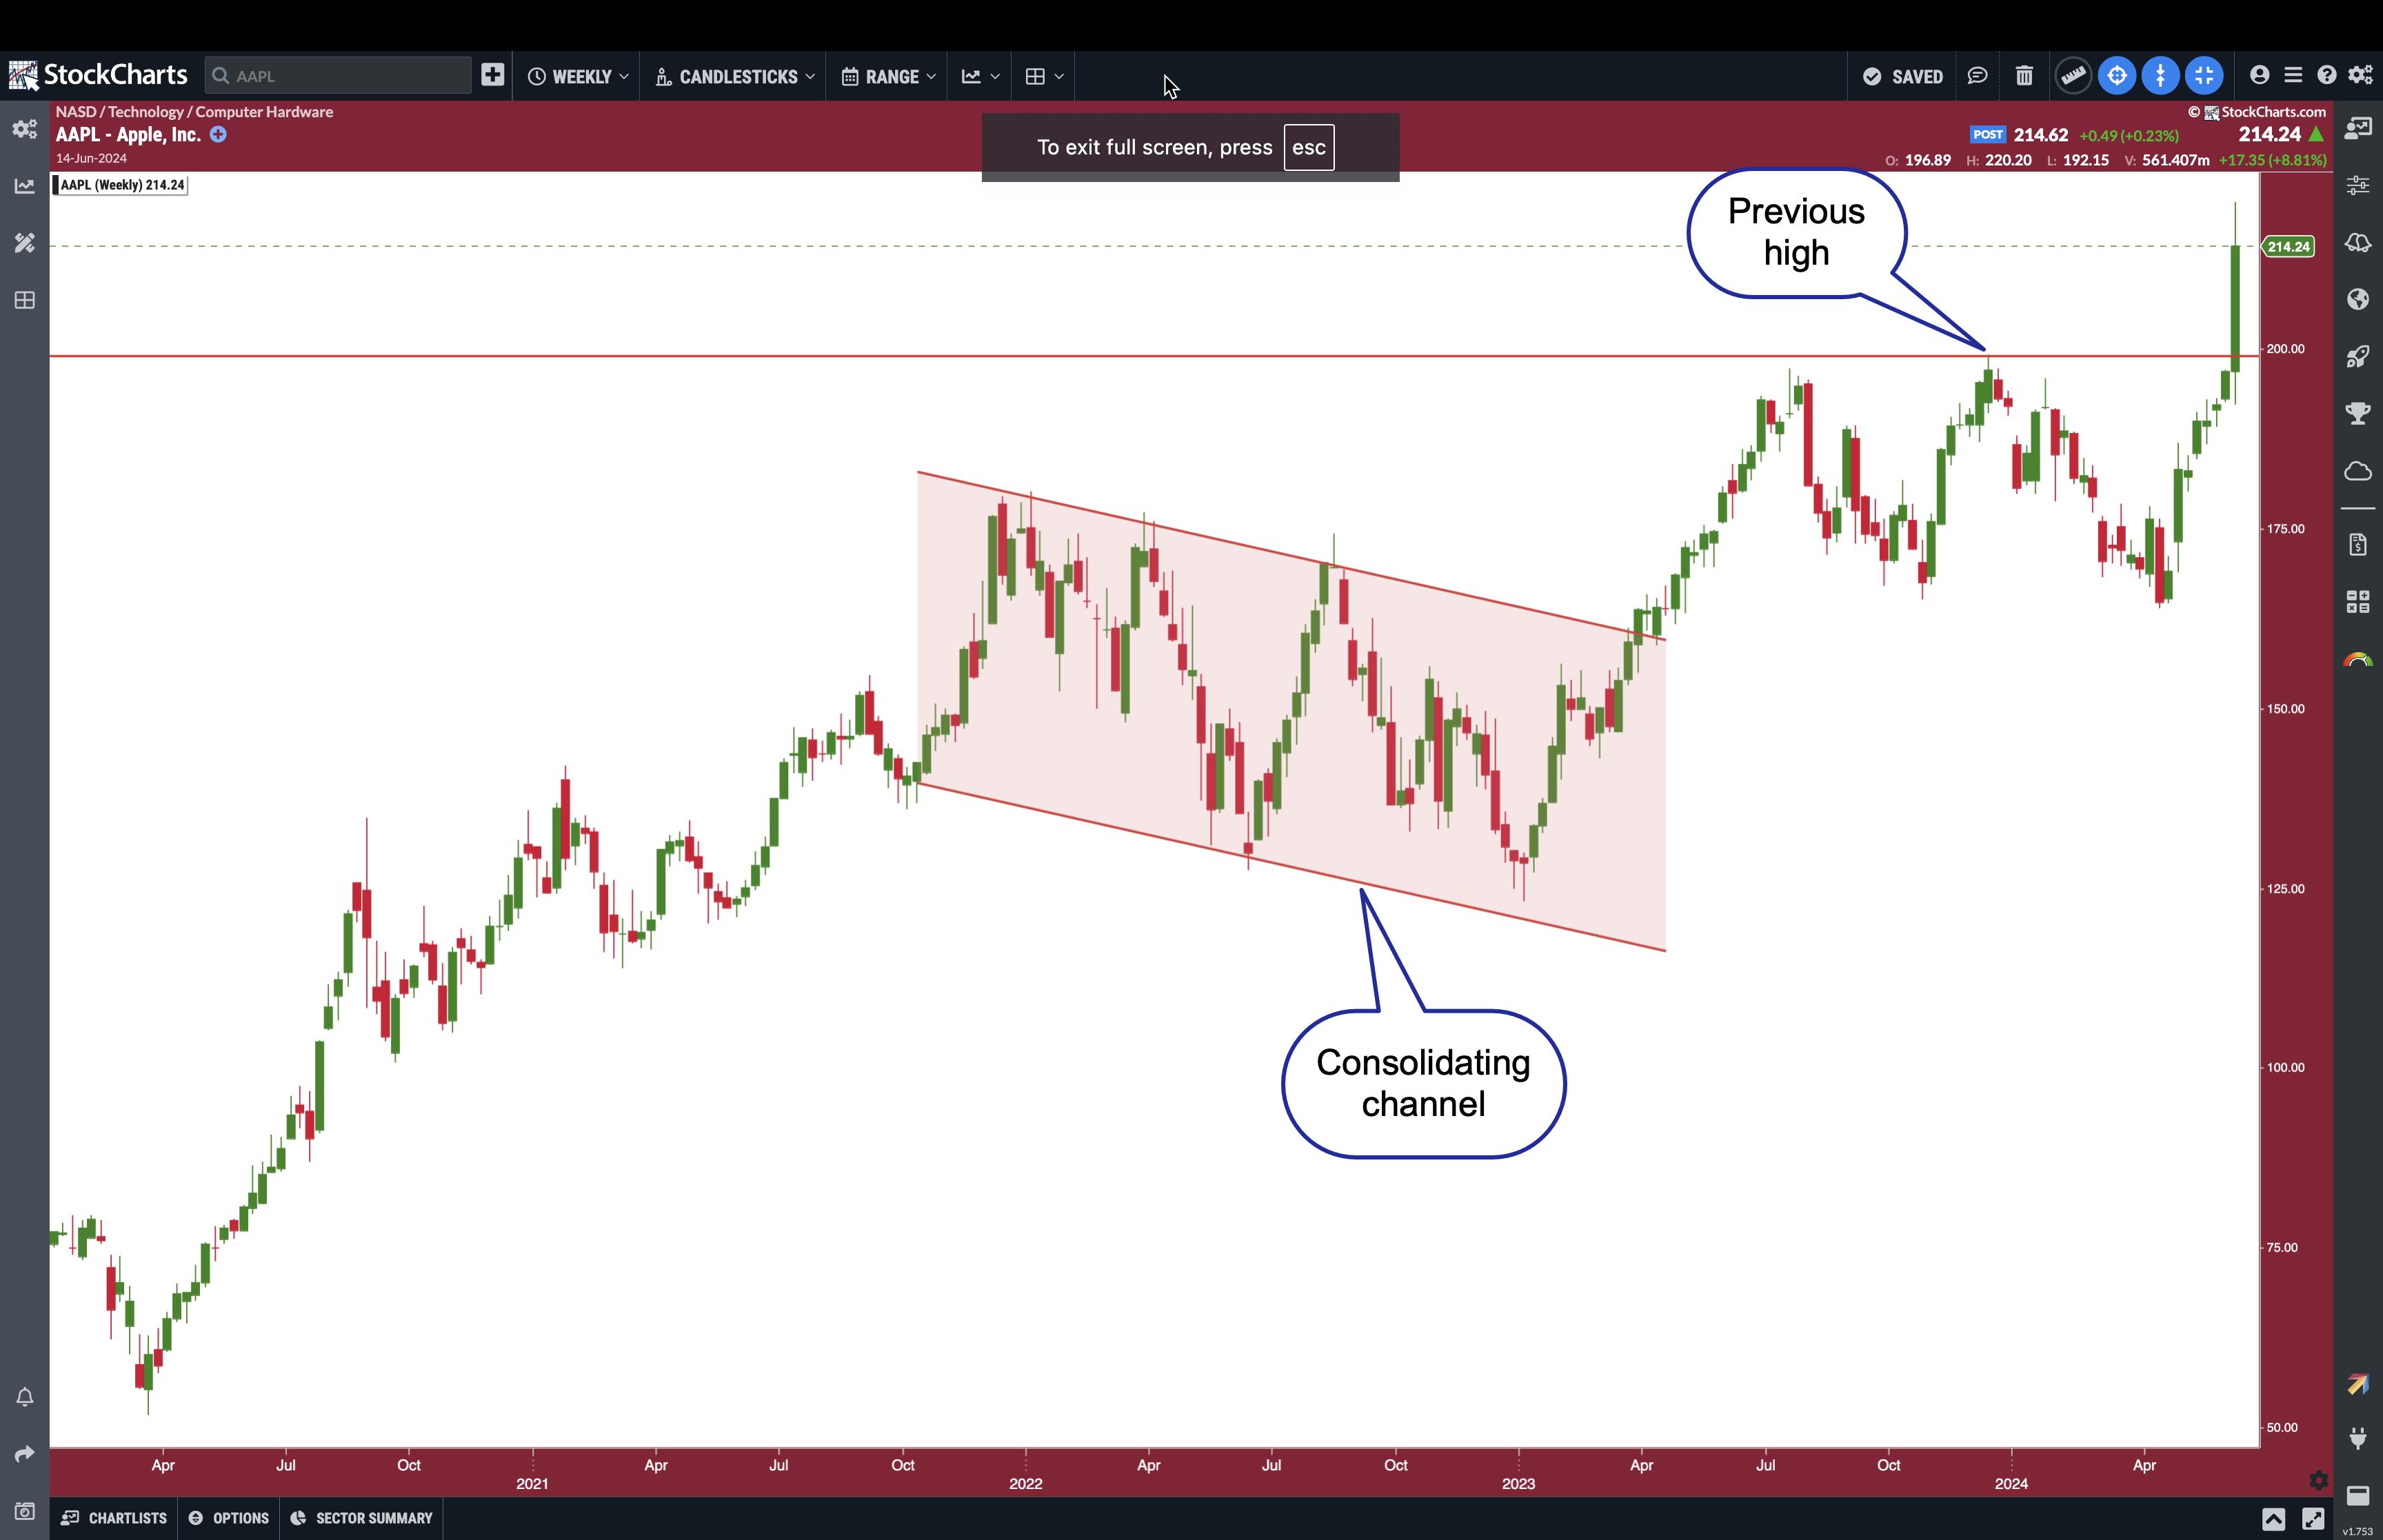
CHART 2. WEEKLY CHART OF APPLE STOCK (AAPL). After breaking out of a consolidation channel in 2022, AAPL traded sideways for almost a year before breaking above its previous high in December.Chart source: StockChartsACP. For educational purposes.
A pullback in AAPL would be a good time to get into the stock, especially if you missed this rally.
Another stock in the news is Tesla, Inc. (TSLA), another S&P 500 stock that took a beating. Today's news about Tesla investors approving Elon Musk's pay package highlighted the stock. TSLA's stock price gapped up but closed near its low. The company faces headwinds such as tariffs on EVs, slowing EV demand, and increased competition.
Technically, TSLA's stock price has broken above a consolidation pattern on above-average volume (see chart below). It's also trading above its 21-day exponential moving average (EMA).
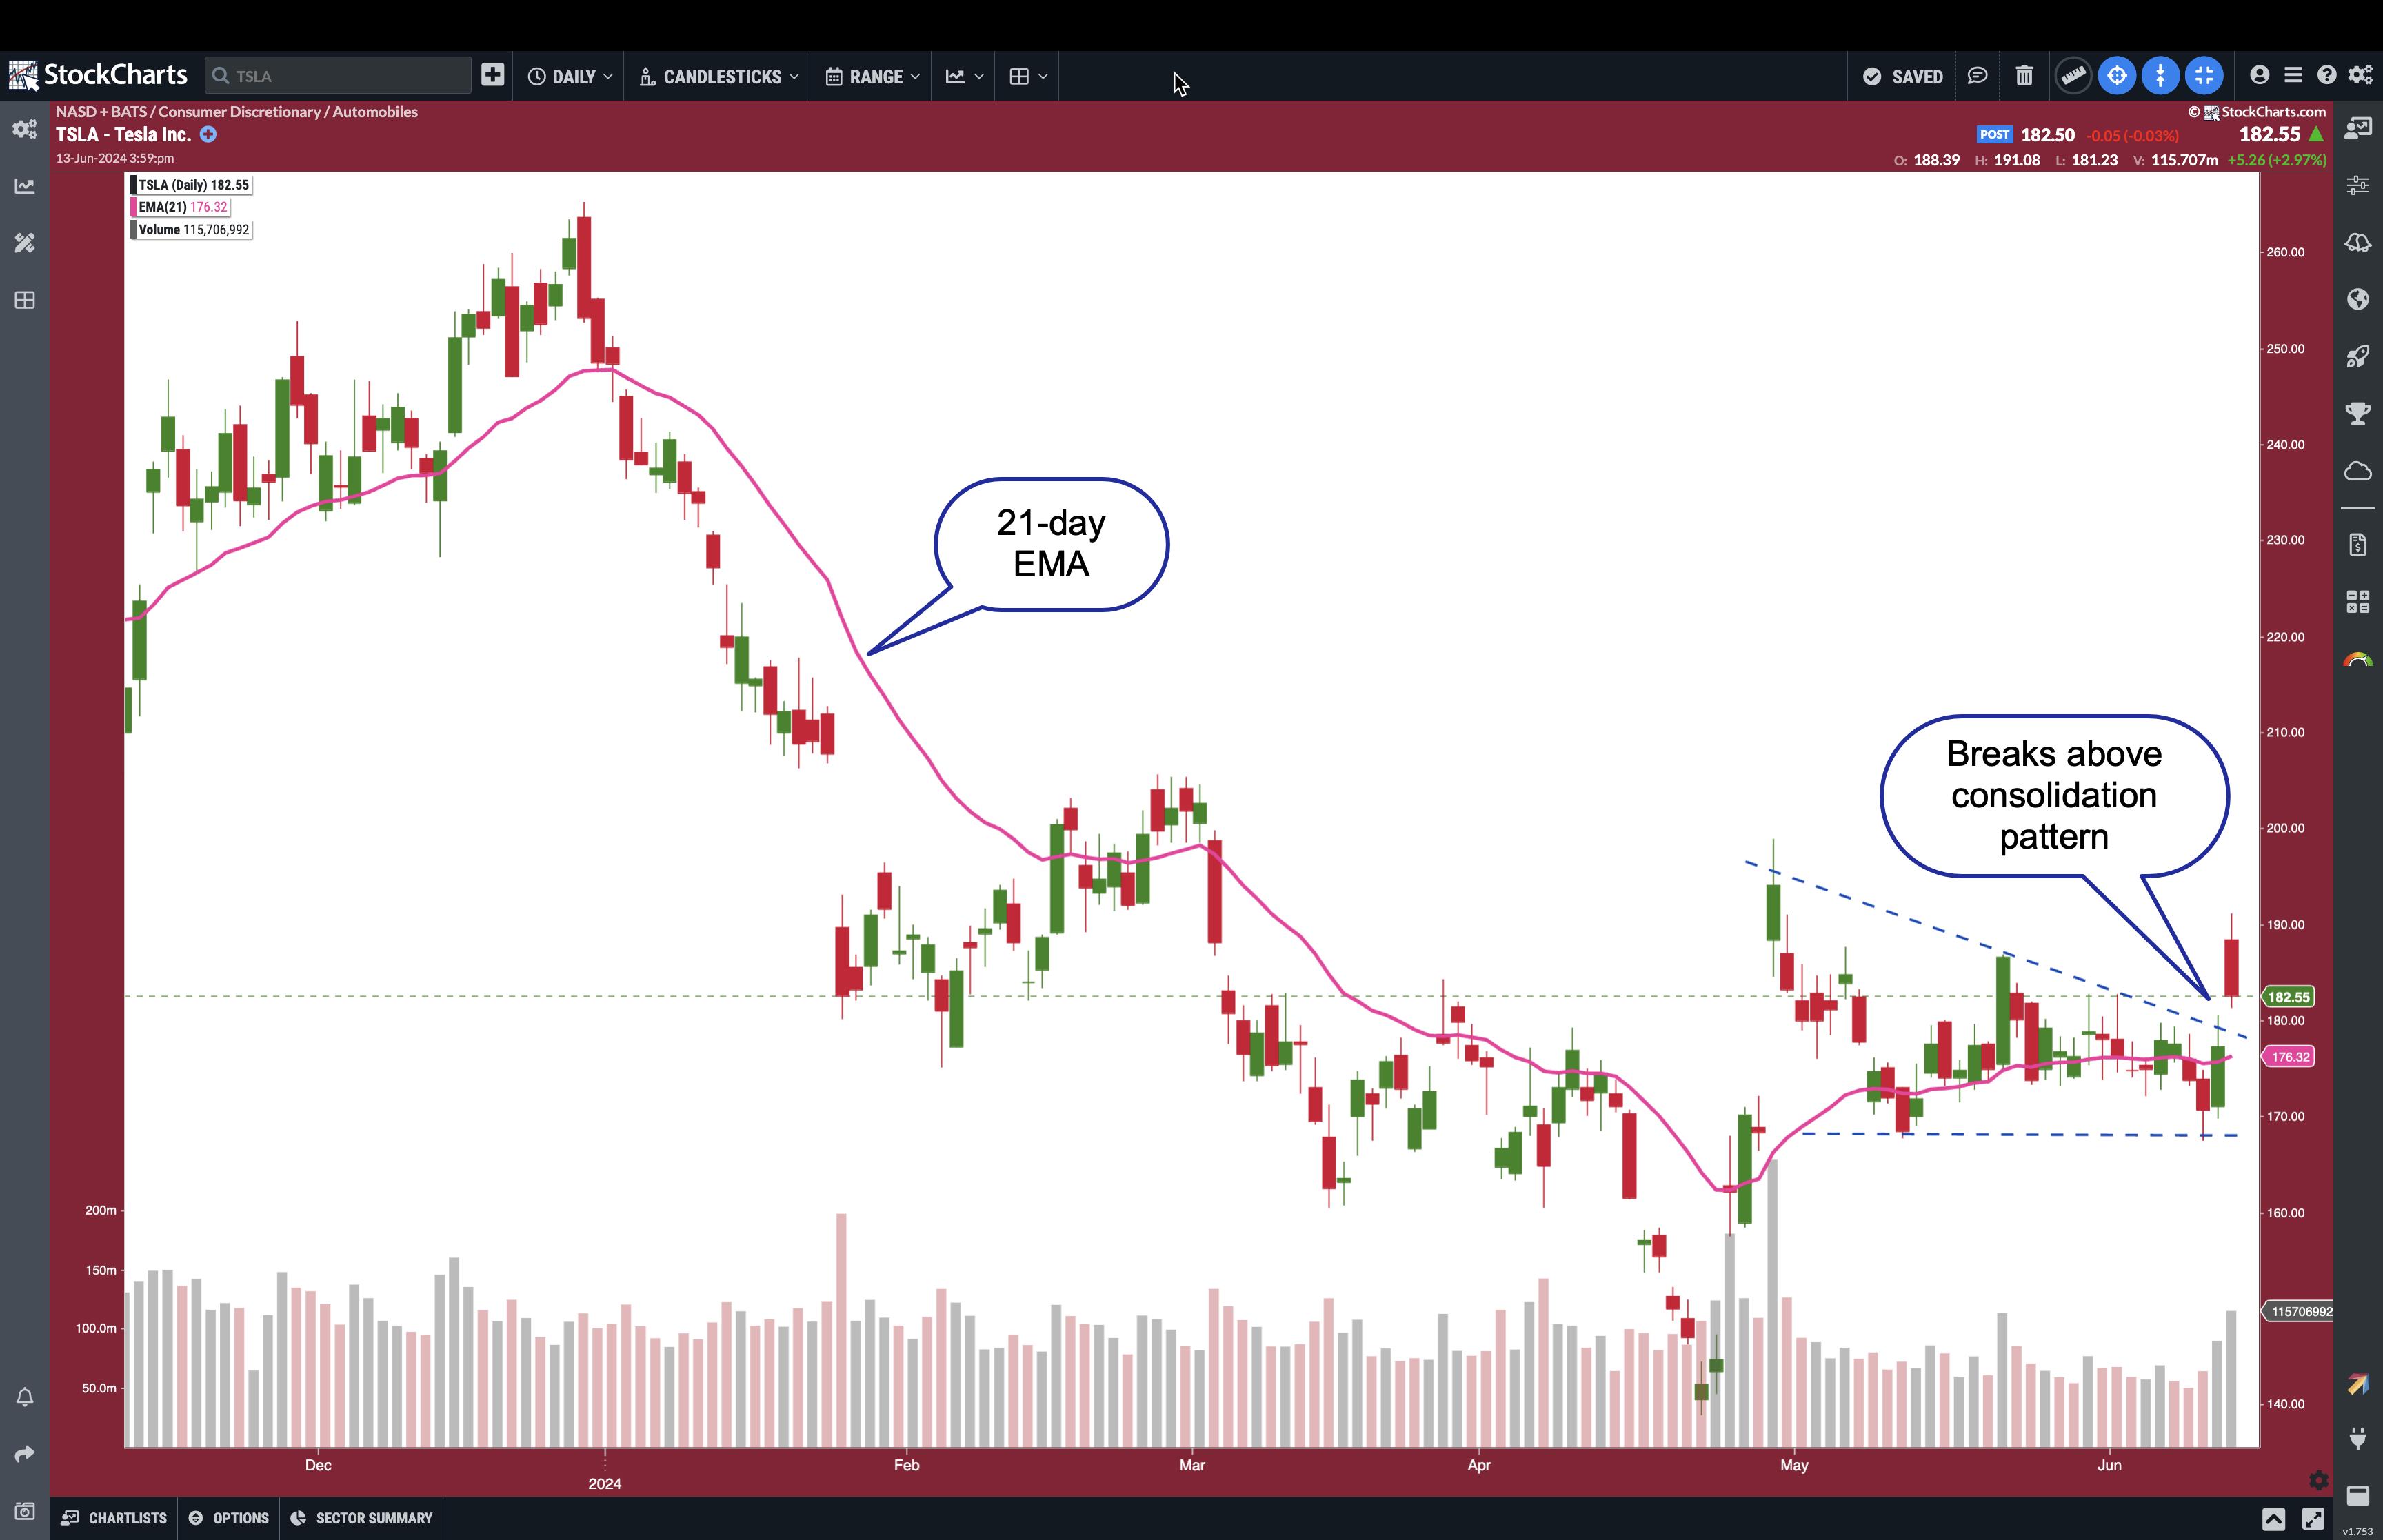
CHART 3. DAILY CHART OF TSLA STOCK. Will the stock price rise if the CEO gets his pay package approval? One day's price action doesn't justify a trend, but it's worth following the stock.Chart source: StockChartsACP. For educational purposes.
We'll know tomorrow if Musk gets his pay package. The outcome will impact TSLA's stock price. Tomorrow ends another trading week. When it comes to large-cap stocks, there are no technical signs of a reversal. Tomorrow may be more of the same. There could be a mild selloff at the end of the trading day, or we could see buyers return. We've seen that happen recently, so don't rule it out.

Disclaimer: This blog is for educational purposes only and should not be construed as financial advice. The ideas and strategies should never be used without first assessing your own personal and financial situation, or without consulting a financial professional.
Happy charting!


