TAKEAWAYS
- Workday, Inc. stock rose higher on strong earnings and guidance
- If Workday stock rises with strong momentum and technical strength, the stock has potential to make for a favorable intermediate-term position trade
- Learn how to set an alert for WDAY stock price to cross a specific threshold

When a stock surges based on a strong earnings report, analyst upgrade, or other fundamental factors, it's tempting to jump into the stock. But often, when a stock's price spikes due to a one-off fundamental event, there'll be a pullback, one that will present a better technical picture of the stock. For this reason, it's best to scope out stocks that have the potential to be an attractive investment, and then set an alert for when the price hits a certain threshold.
Workday Inc. Stock Has Potential
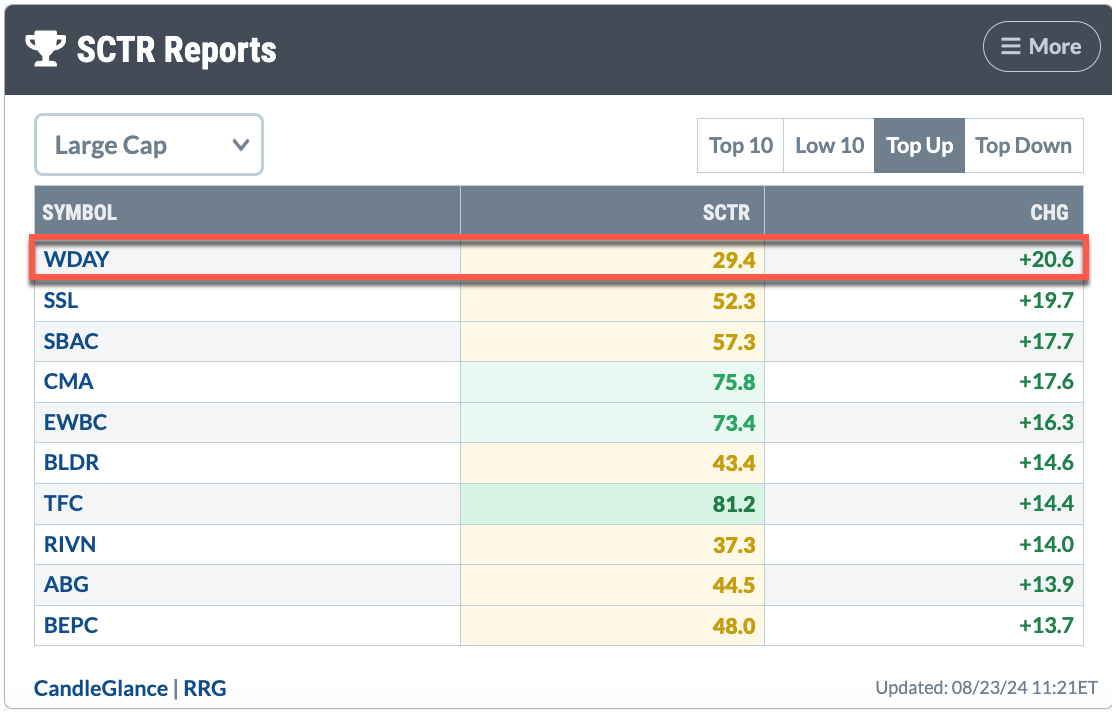
The StockCharts Technical Rank (SCTR) ranked Workday Inc. stock as the highest Top Up in the Large Cap category (this can change during the trading day).
Workday Stock's Price Action
The weekly chart of Workday, Inc. (WDAY) below shows the stock has seen pretty choppy action. As a result, WDAY may be an appropriate intermediate-term trade rather than a long-term investment.
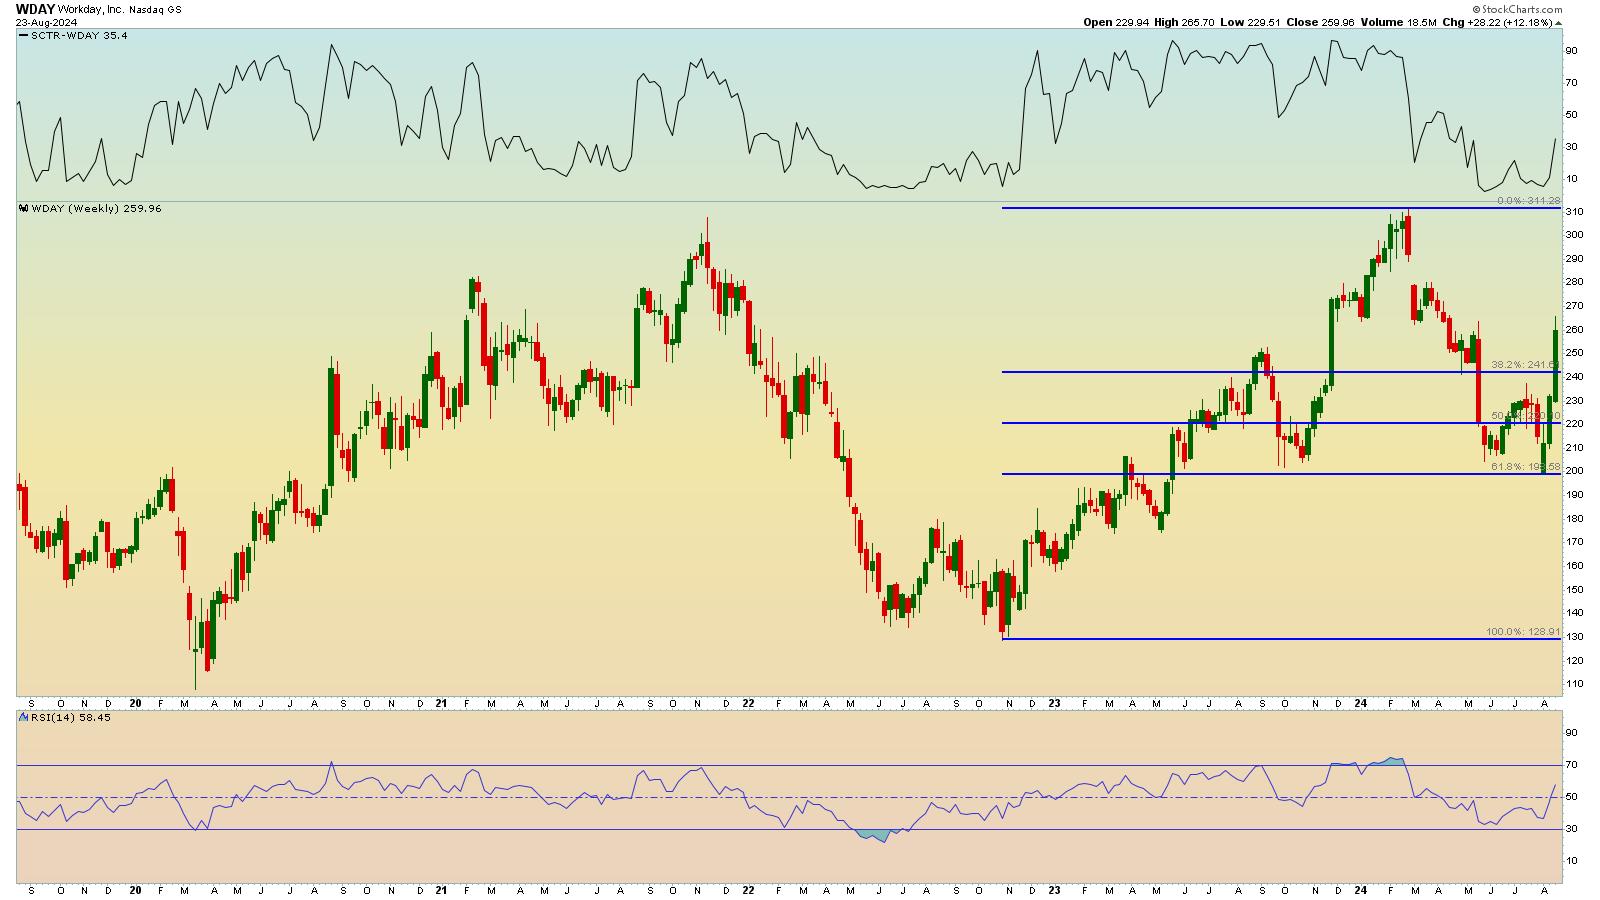
CHART 1. WEEKLY CHART OF WORKDAY STOCK. The stock price has broken above its 38.2% Fibonacci retracement level. If an uptrend (series of higher highs and higher lows) is established, the stock could rise as high as $310.Chart source: StockCharts.com. For educational purposes.
Applying the Fibonacci retracement levels from the most recent low in October 2022 to February 2024 high, WDAY has broken above its 38.2% retracement level. The stock has yet to show an uptrend (series of higher highs and higher lows). Although the relative strength index (RSI) has moved above 50 (lower panel), its SCTR score is relatively low at around 35, though it's spiking (top panel). The stock has the potential to reach $310; however, there are a few resistance levels along the way WDAY has to overcome.
When Should You Buy WDAY?
The daily chart shows that WDAY broke out of a trading range with a massive upside gap (see chart below). Before the gap, the stock price was at its 100-day simple moving average (SMA), which looked like a strong resistance level. Note the 100-day SMA is trending downward.
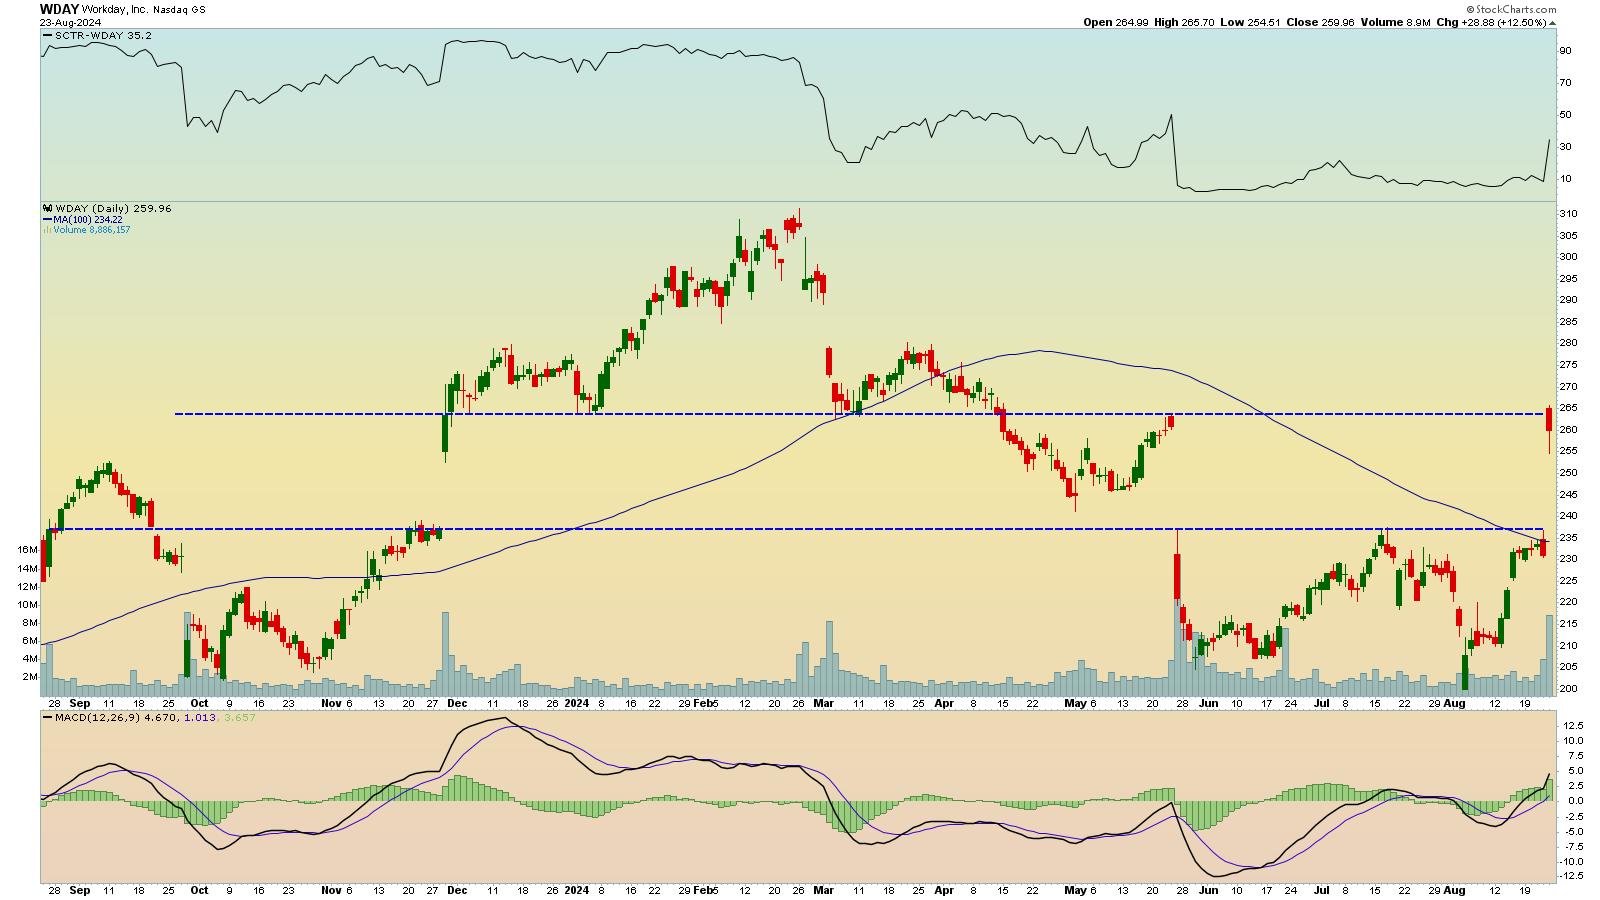
CHART 2. DAILY CHART OF WORKDAY STOCK. The stock price gapped higher on a strong earnings report. Is it enough to push the price higher toward its all-time high?Chart source: StockCharts.com. For educational purposes.
Had it not been for the strong earnings report, the stock may have fallen. The one-day gap up in price makes it difficult to determine when to enter a long position in WDAY stock. The candlestick bar suggests that the stock is trying to move higher, but faces greater selling pressure. This indicates there could be a pullback in price together with slowing momentum. You want to see momentum increase before buying a stock, so it makes sense to add a momentum indicator, such as the Moving Average Convergence/Divergence (MACD), to your analysis.

In the daily chart, the MACD line crossed above the signal line (lower panel) and has moved above the zero line. The height of the MACD histogram bars is also increasing. All these point to increasing buying pressure, but it's in the early stages.
Looking at the overall chart, if WDAY stock price falls and fills the gap, look for an entry point just above the lower blue dashed line as long as the momentum remains strong. If the momentum weakens, there's no reason to enter a trade.
Conversely, the stock price could continue to rise above the upper blue dashed line. There needs to be an increase in momentum so there's follow-through in the upside price movement. If accompanied by a rise in the SCTR score above the 70 level, it could make for a profitable position trade, given that WDAY's stock price could go as high as $310. Always place a stop-loss order a little below your entry price, and if the stock price moves in your favor, use a trailing stop.
When Should You Exit WDAY?
Since this is a position trade, don't let your emotions get in the way. Any time your entry conditions are violated, exit the trade. There are always opportunities in the stock market. There's no reason to tie your capital into one trade that's not going the way you want it to go.
The bottom line. Save WDAY to your ChartList and set an alert for when the SCTR score crosses above 70.
Setting alerts using SCTR is straightforward. Enter the following when creating a new advanced alert:
Alert for WDAY SCTR crossing above 70
[symbol = ‘wday']
and [sctr > 70]
Happy charting!
