TAKEAWAYS
- The SCTR Report highlighted two gold miner ETFs, indicating that the industry is seeing positive movement.
- A deeper dive into gold miner ETFs uncovers problems and opportunities.
- The ZigZag line applied to the chart of GDX helps identify entry and exit levels.
On Thursday afternoon, I dove into the StockChartsTechnicalRank (SCTR) Reports to scout out a good ETF during a mixed market (Dow and S&P 500 were down, Nasdaq was up).
Two gold miner ETFs—Wisdom Tree Efficient Gold Plus Gold Miners ETF (GDMN) and iShares MSCI Global Gold Miners ETF (RING)—caught my eye. Both had high SCTR scores of 99.9 and 99.6, respectively.
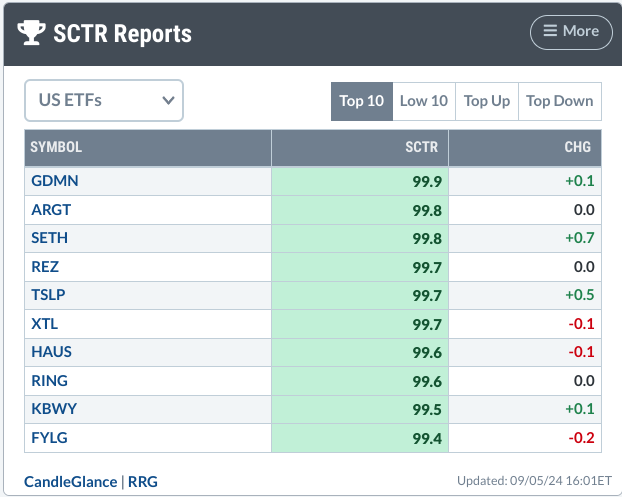
THE SCTR REPORT FOR US ETFs.
Everyone's been talking about gold since it started climbing back in October 2022. But gold mining companies? Not so much.
Does this present an opportunity for investment, given ongoing geopolitical tensions, central bank demand, and the much-anticipated Fed rate cuts? Possibly. But let's dig deeper to try to get a deeper technical view as to what's going on.
Comparing GDMN to RING (and Gold)
First, GDMN and RING share a few of the same companies, but overall, they have different holdings. Let's compare the performance of both companies and, out of curiosity, see how both compare to gold.
Open the StockCharts PerfCharts (under Member Tools or Charts & Tools) and enter GDMN,RING,$GOLD in the symbols box.
If you set the time parameters to one year, you get something like the chart below.
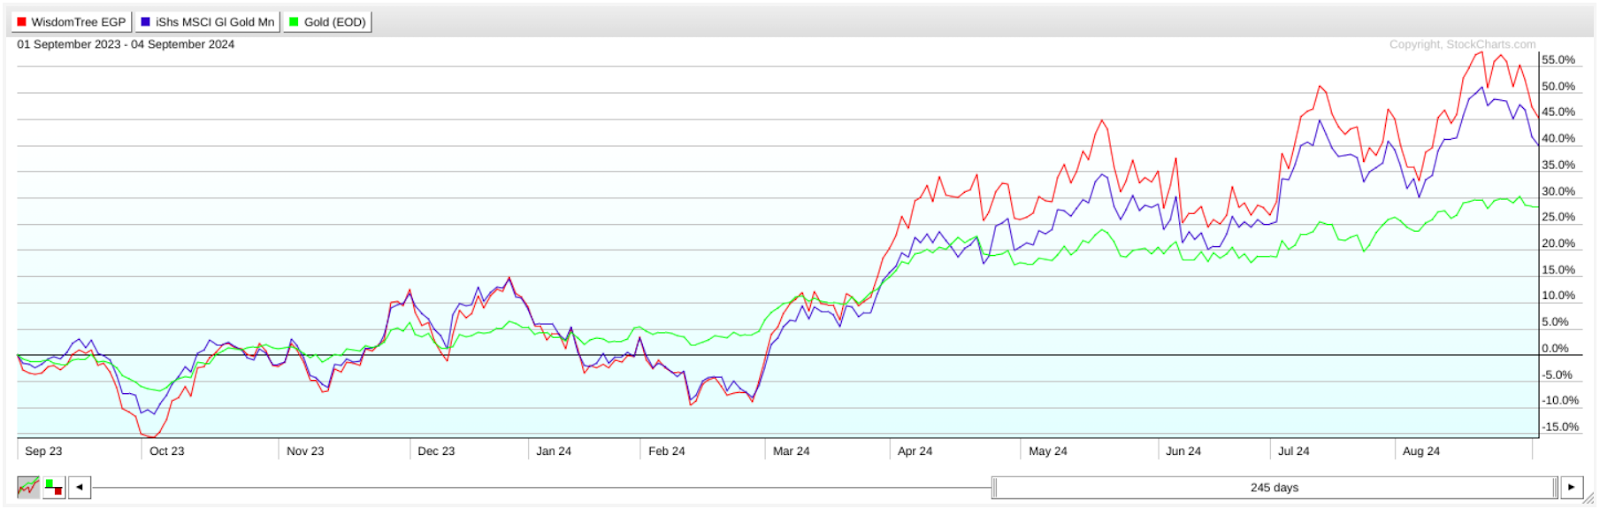
CHART 1. PERFCHART OF GDMN, RING, AND GOLD. GDMN is the red line, RING, the blue line, and gold, the green line. Chart source: StockCharts.com. For educational purposes.
Notice how both miners started outperforming gold in April, with GDMN leading the pack. But if you follow gold's seasonality context, you know that the yellow metal dips in the summer before making a big move in the fall.
That's gold. But what about gold miners? Let's check the Dow Jones Gold Mining Index ($DJUSPM).
Under Charts & Tools, select Seasonality and enter $DJUSPM in the symbol box.
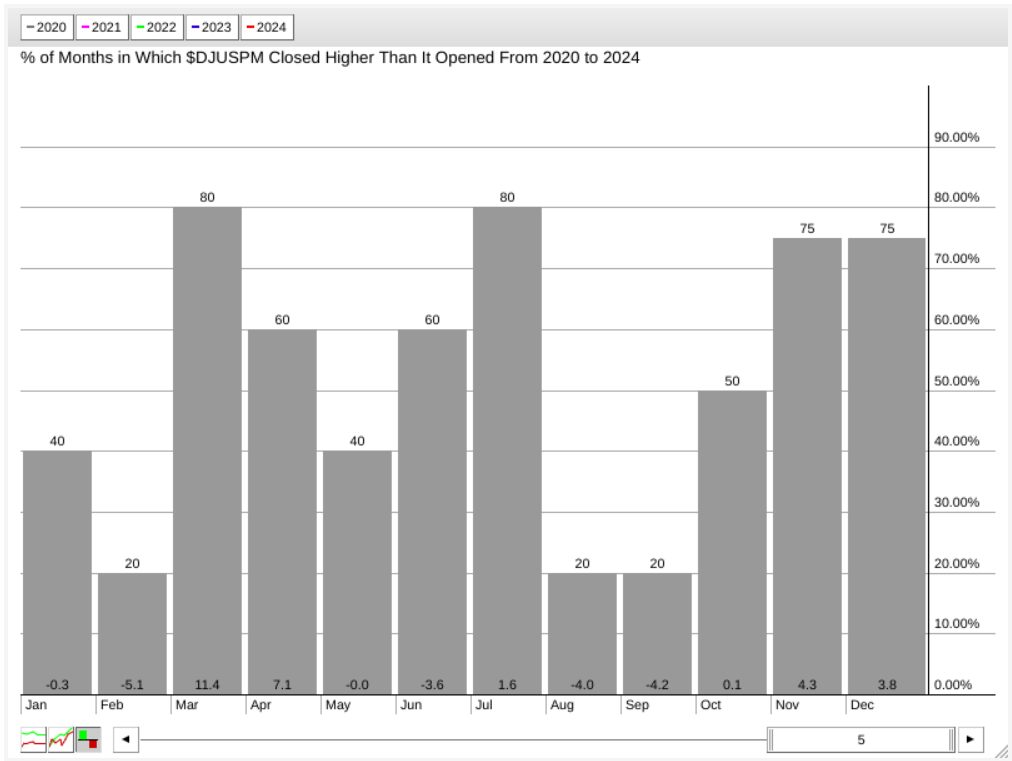
CHART 2. FIVE-YEAR SEASONALITY CHART OF DOW JONES GOLD MINING INDEX. The number at the top of the bar indicates higher-close %, while the numbers at the bottom indicate average % return.Chart source: StockCharts.com. For educational purposes.
Over the last five years, August and September were the weakest months for gold miners. November and December both notched second best. March and April were the most outstanding months.
Gold demand has climbed over the last five years. Given the current economic and geopolitical context, how these numbers will pan out is unclear. But you have to check the price action if you're bullish gold miners—and miners' technical readings are outstandingly bullish right now.
Analyzing GDMN and RING
Are GDMN and RING the best mining indexes to trade? Both have high SCTR scores, and we know that gold miners, in general, have been on a steady rise.
But look at their trading volumes. In the Symbol Summary tool, type in each symbol.
- GDMN has an incredibly low volume of 628 (no market cap listed)
- RING's volume is a little better, with 41,863 and a market cap of 517M
Gold mining ETFs generally have low liquidity, making them difficult to trade. A better and more liquid representation of gold miners is the VanEck Vectors Gold Miners ETF (GDX), which has a market cap of $13.66B and an average trading volume of around 7,259,656.
Let's analyze its daily chart.
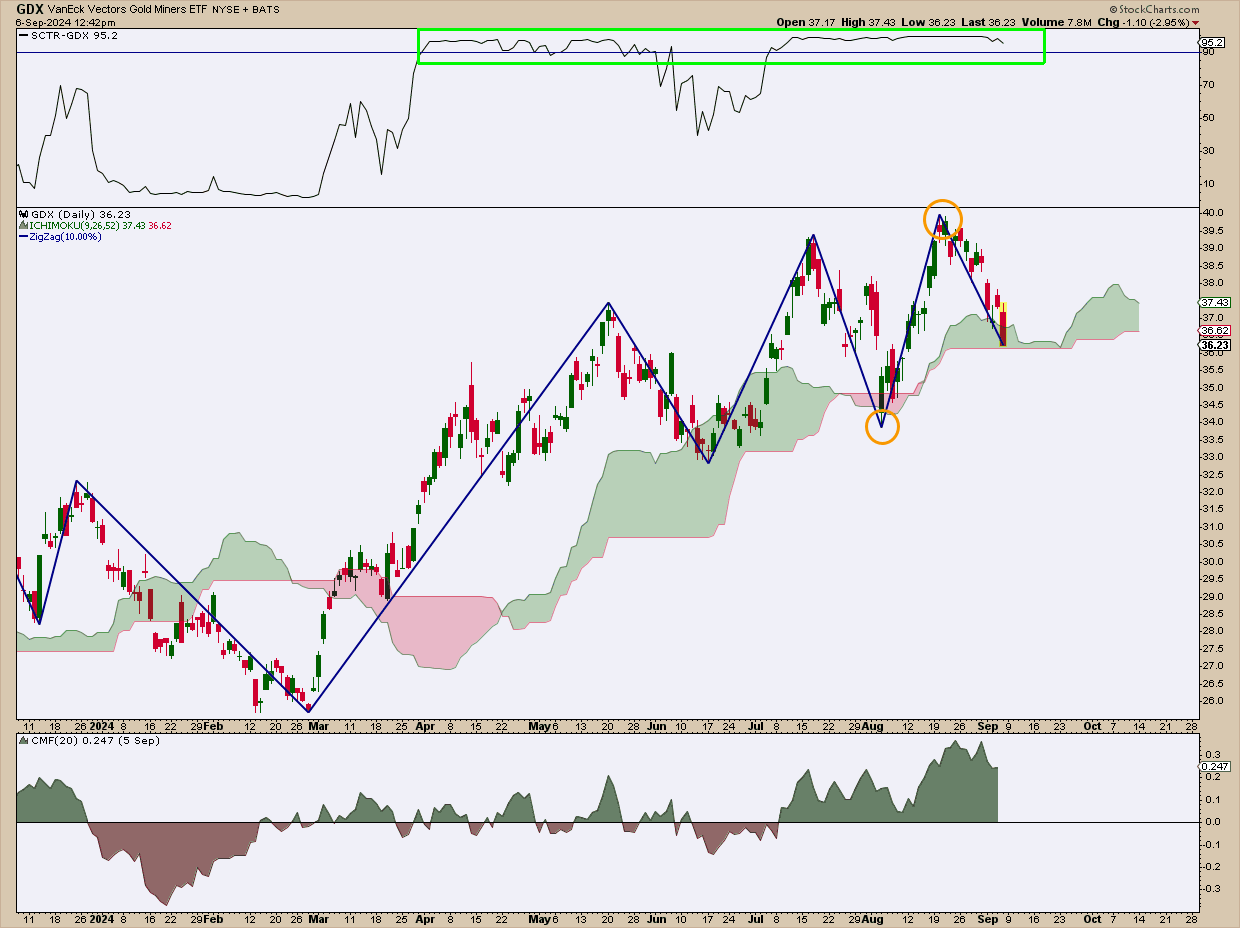
CHART 3. DAILY CHART OF GDX. Note the clear trend swing points.Chart source: StockCharts.com. For educational purposes.
First, notice that the SCTR reading has been well above the 90 line (see green rectangle in the top panel), indicating extreme bullishness across several indicators and timeframes. The Chaikin Money Flow (CMF) has been rising since July, indicating strong buying pressure.
The Ichimoku Cloud has been a reliable indicator of support since GDX established a near-term uptrend in March. As GDX is now touching the cloud (the ETF is a candidate in the Entered Ichimoku Cloud predefined scan), it might signal a favorable entry point.
More importantly, the ZigZag line, highlighting GDX's swing points, is key to determining the trend and entry and stop loss levels. Basically, if an uptrend is defined as higher highs and higher lows, then for GDX's uptrend to remain valid, it has to eventually break above $40, its most recent swing high, and it can't close below its most recent swing low of $34 (see orange circles).
At the Close
SCTR reports can be a powerful starting point for spotting market opportunities. In this case, the report led me to gold miners, but finding a truly tradable option—like GDX—required some extra research. SCTR points you in the right direction, and, with a little homework using additional StockCharts tools, you can uncover attractive trading opportunities.
Disclaimer: This blog is for educational purposes only and should not be construed as financial advice. The ideas and strategies should never be used without first assessing your own personal and financial situation, or without consulting a financial professional.
Happy charting!


