TAKEAWAYS
- A successful test of FXI's secondary test of its 2022 low will show strength
- If FXI's secondary test fails, weakness could result in the ETF
- Looking at ratio charts, a potential FXI:EWJ spread trade could present lucrative trading opportunities

The iShares China Large-Cap exchange-traded fund (FXI) holds the 50 largest large-cap Chinese stocks that trade on the Hong Kong exchange.
FXI could soon make a secondary test of its 2022 low. A successful test will show strength, but a failed test will show weakness. Either outcome can produce a meaningful directional move offering multiple trading opportunities. This is the kind of setup or juncture around which I like to build agnostic trading plans. Either way, I will have a trading and risk management plan in place to take advantage of either outcome.
In a macro sense, there isn't much going on in China, leading me to optimism. China is a command economy run by a communist regime in the process of retreating from capitalism. Importantly, leadership seems to be increasingly resistant to providing adequate fiscal stimulus. To that list, you can add a rapidly aging population, a world increasingly resistant to buying their goods, a rethinking of global supply lines, and significant raw material and climate challenges. Granted, there are positives. They are becoming a microchip superpower and have made significant technological advances over the last five years. In my view, the negatives outweigh the positives by quite a lot.
My macro view informs my aggressiveness and risk tolerance. But if a technical setup provides a clear risk-reward advantage, a conflicted macro view never deters me from making a trade. Technical setups are far more actionable than fundamental beliefs. And it is always good to remember that, the more widely accepted a viewpoint becomes, the more susceptible a market becomes to mean reversion or reversal.
Monthly Perspective of FXI
The monthly chart of FXI below shows some significant technical developments.
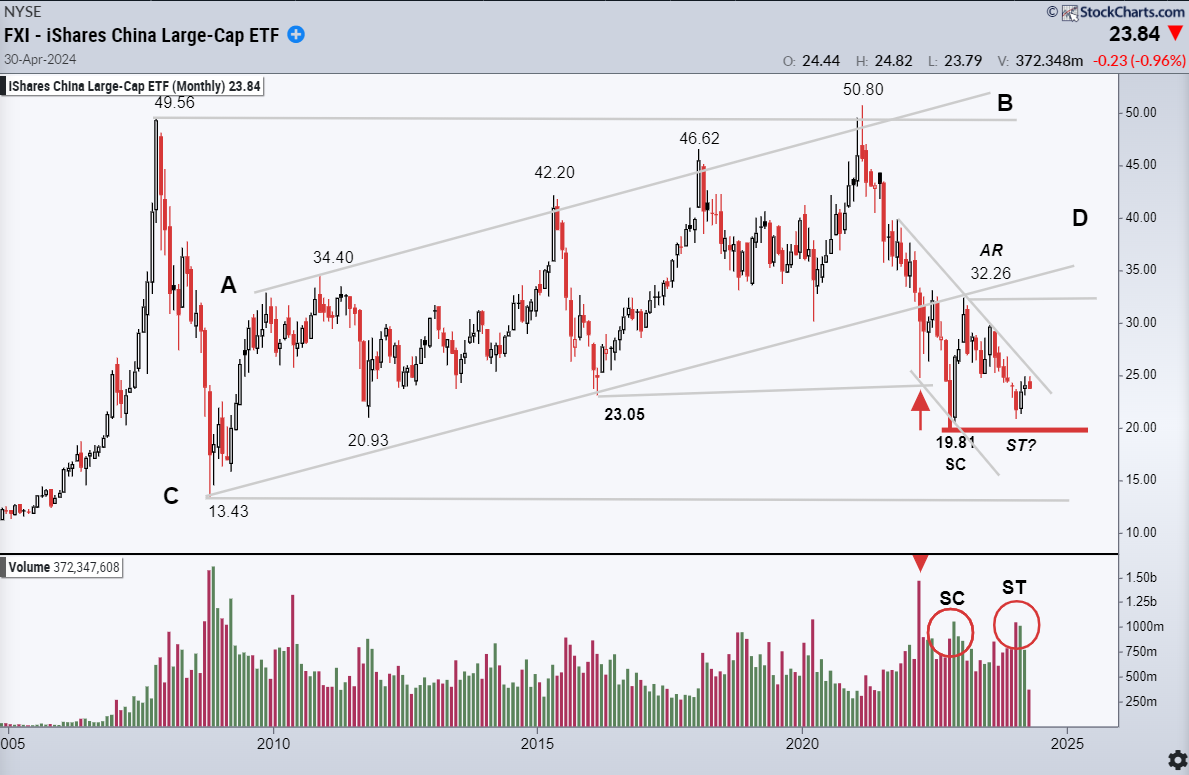
FIGURE 1: MONTHLY CHART OF FXI.
Chart Takeaways:
- FXI is confined within the more extensive 13.43–50.80 range developed since the ETF began trading (four years after China joined the World Trade Organization).
- In 2021, after slightly up-thrusting the October 2007 high, the market began a vicious decline (-60%). The decline from the February 2021 high occurred on rising volume and a wide price spread (suggesting strong-handed selling). The move was impulsive.
- In early 2022, FXI fell out of the broad rising channel (A-B, C-D) that had defined the general price action for most of the prior 15 years.
- The fallout of the channel created strong selling, but a temporary selling climax developed (red arrow) as the market reached the lateral support at 23.05 and opportunistic buying emerged.
- The minor climax produced a small automatic rally that quickly ran into resistance along the lows of the broken channel. The market then devolved into a four-month show of weakness.
- The weakness occurred on a wide price spread and growing volume before potentially developing a complex selling climax (SC). Note that while the SC appears complex in this perspective, it appears more traditional in the daily perspective.
- The automatic rally (AR) lasted four months and found resistance in the same 32–33.00 zone that had turned the market lower in March 2022.
- After testing the resistance, FXI began setting back toward the selling climax low (19.81). Note that during the most recent decline, the angle of decline was shallower than that of the larger (50.80–19.81) decline and that the volume has been somewhat lighter. The shallower angle and lighter volume suggest less supply entering than on the prior decline.
- The recent pullback toward the October 2022 low may be developing as a secondary test. The outcome of that test is likely to develop into a significant directional move.
- The solid volume expansion around the recent low (ST?) suggests strong-handed buying and that the secondary test may be complete, pending a show of strength.
Let's turn to momentum.
FXI Monthly Momentum
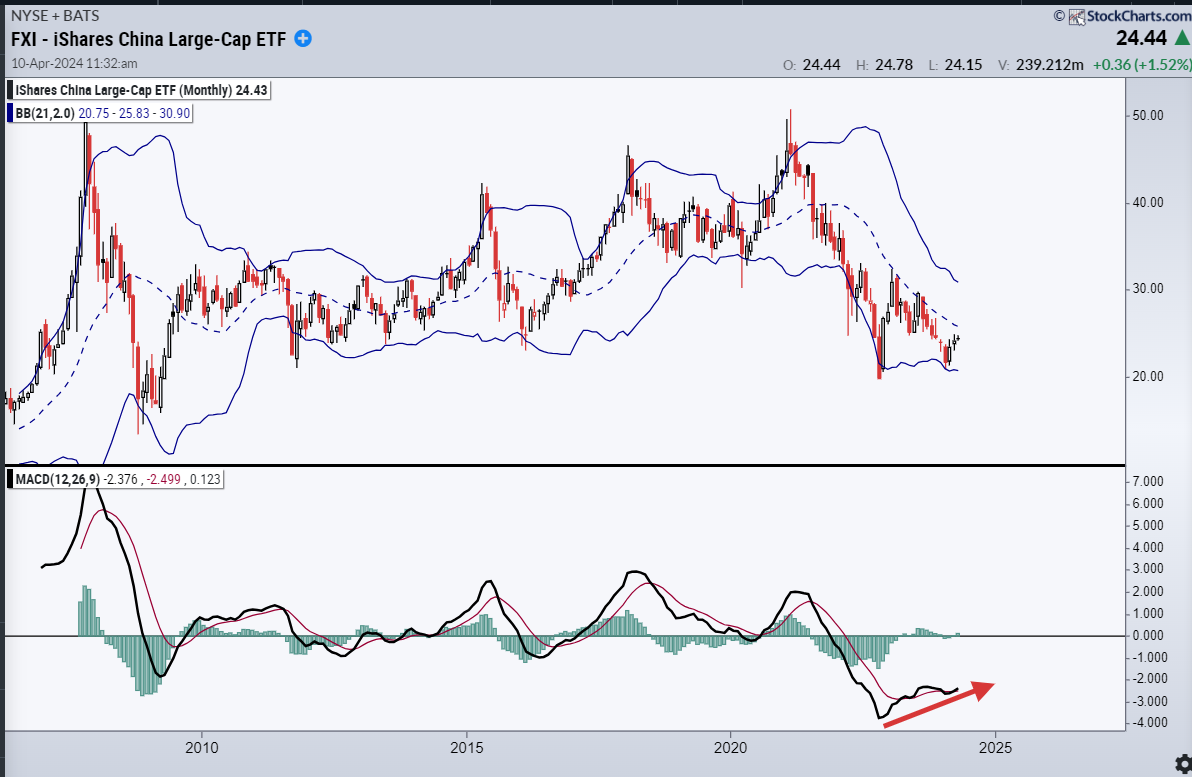
FIGURE 2: MOMENTUM IN FXI. The MACD histogram has turned positive. A push to the upper half of the Bollinger Band would be positive for FXI.Chart source: StockChartsACP. For educational purposes.Momentum takeaways:
- Momentum is diverging significantly from price, and the Moving Average Convergence/Divergence Oscillator (MACD) histogram has turned positive. This oscillator condition and strength from this position in the trend would be highly positive.
- Price has been confined in the lower portion of the Bollinger Band since July 2021. A push into the upper half of the band would mark a significant change in the market's character. Note that the B-band is narrow. Narrow B-bands often immediately precede trending moves.
Weekly Perspective of FXI
After evaluating the monthly perspective, I will turn to the weekly perspective. I prefer to trade in this (the weekly) perspective.
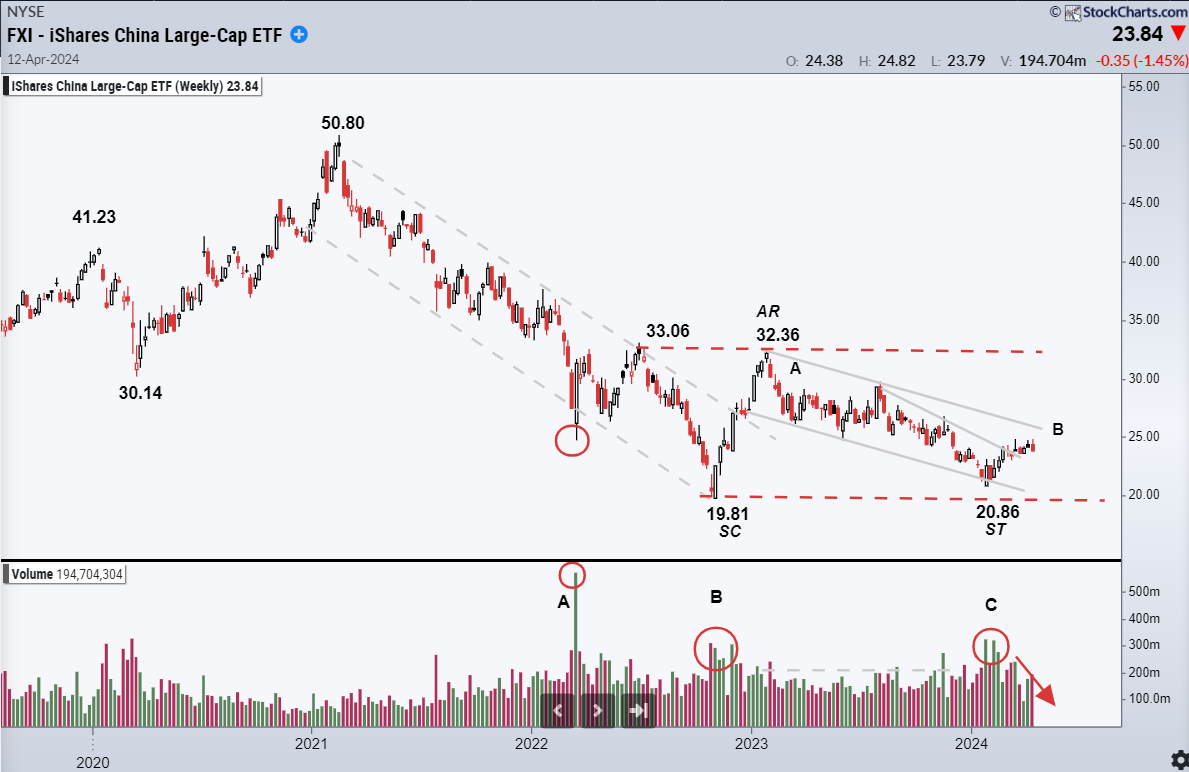
FIGURE 3. WEEKLY CHART OF FXI. If the ETF moves well above the recent downtrend (A-B) and the volume and price spread expands, consider bullish setups.Chart source: StockChartsACP. For educational purposes.
Chart takeaways:
- The price/volume relationships detailed in the monthly perspective are seen more clearly.
- The false selling climax at A, complex climax at B, automatic rally to 32.36, and low volume decline (note the shallow angle) to point C.
- The strong volume at point C suggests that strong hands may be accumulating shares around the prior low.
- As the market has advanced from the 20.86 low, volume and price spread have declined. While supply seems limited, demand is still lacking. The odds of a setback to test 20.86 or perhaps even to provide a fuller test of the 19.81 low are still good.
- In my opinion, it's premature to conclude that the secondary test is complete. But if the market begins working its way above the downtrend defining the potential test (A–B), particularly if volume and price spread expands, it would likely signal a completed test. This would allow me to begin utilizing bullish setups with confidence.
Daily Perspective of FXI
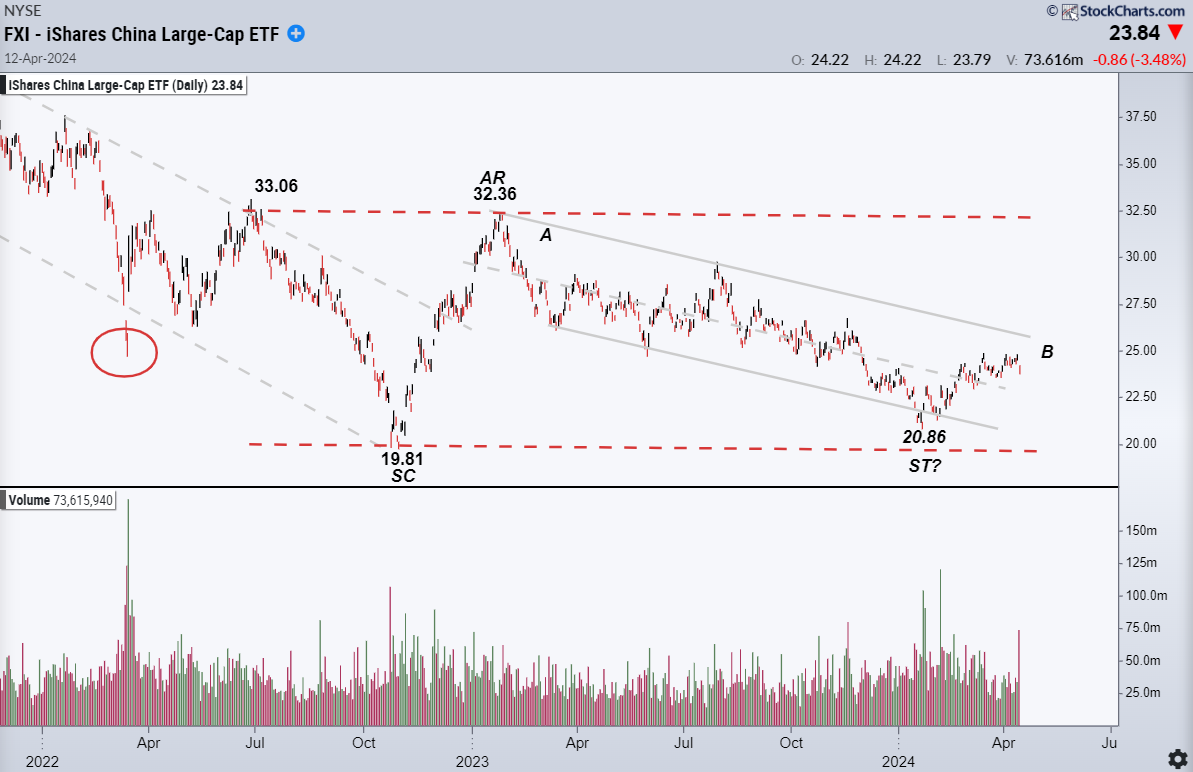
FIGURE 4. DAILY CHART OF FXI. Seeing strength above the A to B downtrend would indicate FXI has bottomed. If FXI breaks out above the downtrend channel, consider entering bull flags and other corrective style drift patterns.Chart source: StockChartsACP. For educational purposes.A show of strength above the A–B would suggest that a good bottom was in. If that level is exceeded, entering bull flags and other corrective style drift patterns should provide good entries.
Lastly, I evaluate the daily perspective to see if the larger price and volume characteristics still hold in the detail.
- The initial selling climax (SC) stands out more clearly. Note that this was a large lower gap day (opened far below the prior day's close) but closed well off the day's low.
- The drift lower (A-B) is well-defined, has occurred on generally low volume, and the angle of the testing decline is shallow.
- I prefer secondary tests that are well separated in terms of time and that come close to fully retracing the climax structure. This structure qualifies in both respects. I prefer a deeper cut toward the 19.81 low, but 20.86 is close enough.
- Note that volume has declined markedly, and the price spread has narrowed as the market rallied over the last few weeks. This is not ideal and suggests that the secondary test structure may be incomplete.
- A show of strength above the A–B would suggest that a good bottom was in. If that level is exceeded, entering bull flags and other corrective style drift patterns should provide good entries.
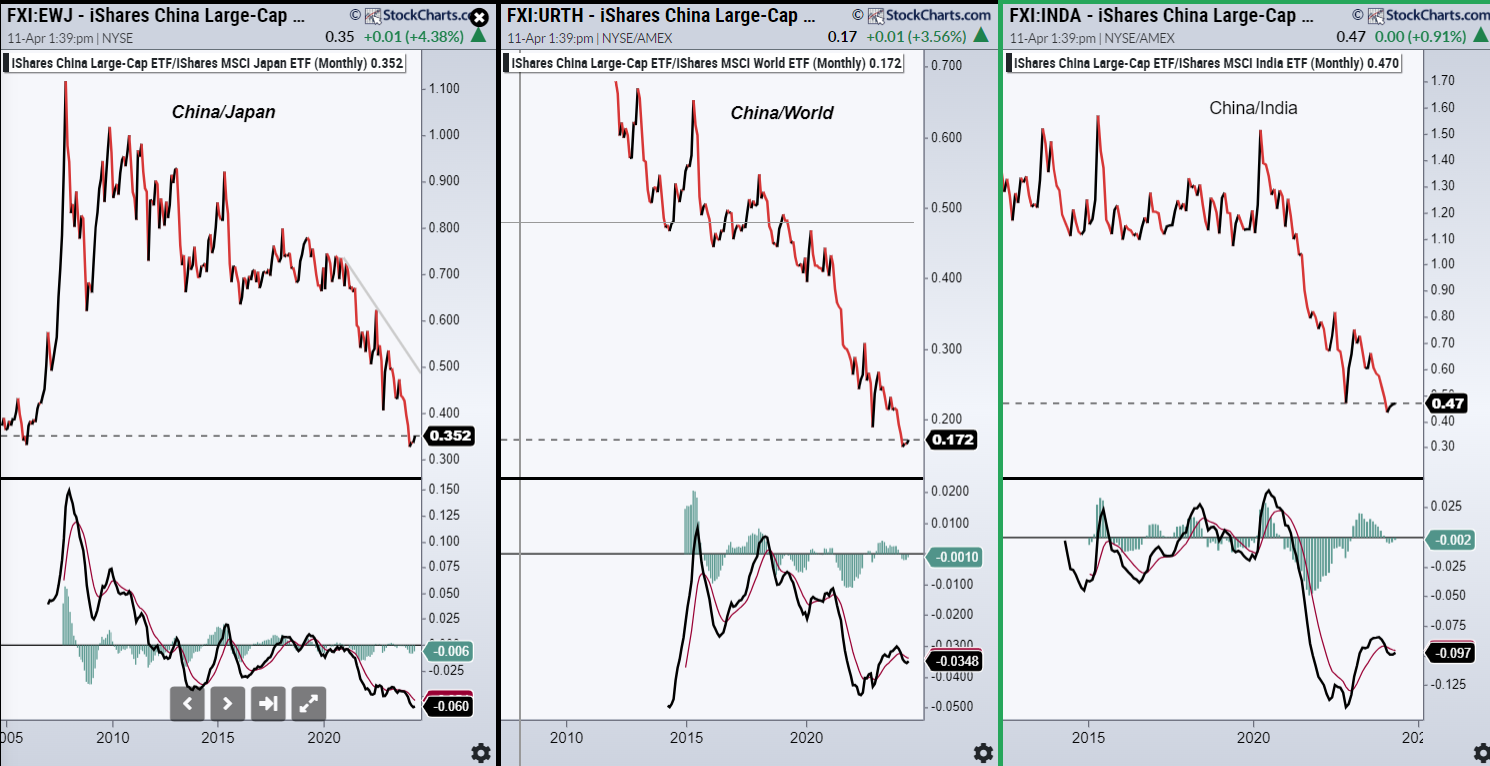
Relative Strength Ratio Chart Weekly: China/Japan, China/World, and China/India
Below are monthly relative strength charts comparing FXI to iShares MSCI Japan ETF (EWJ), iShares MSCI World ETF (URTH), and iShares MSCI India ETF (INDA). China has consistently underperformed all three. Becoming optimistic about anything beyond a trading turn would require the Chinese market to strengthen markedly relative to the rest of the world.
Monthly Perspective of MSCI Japan (EWJ)
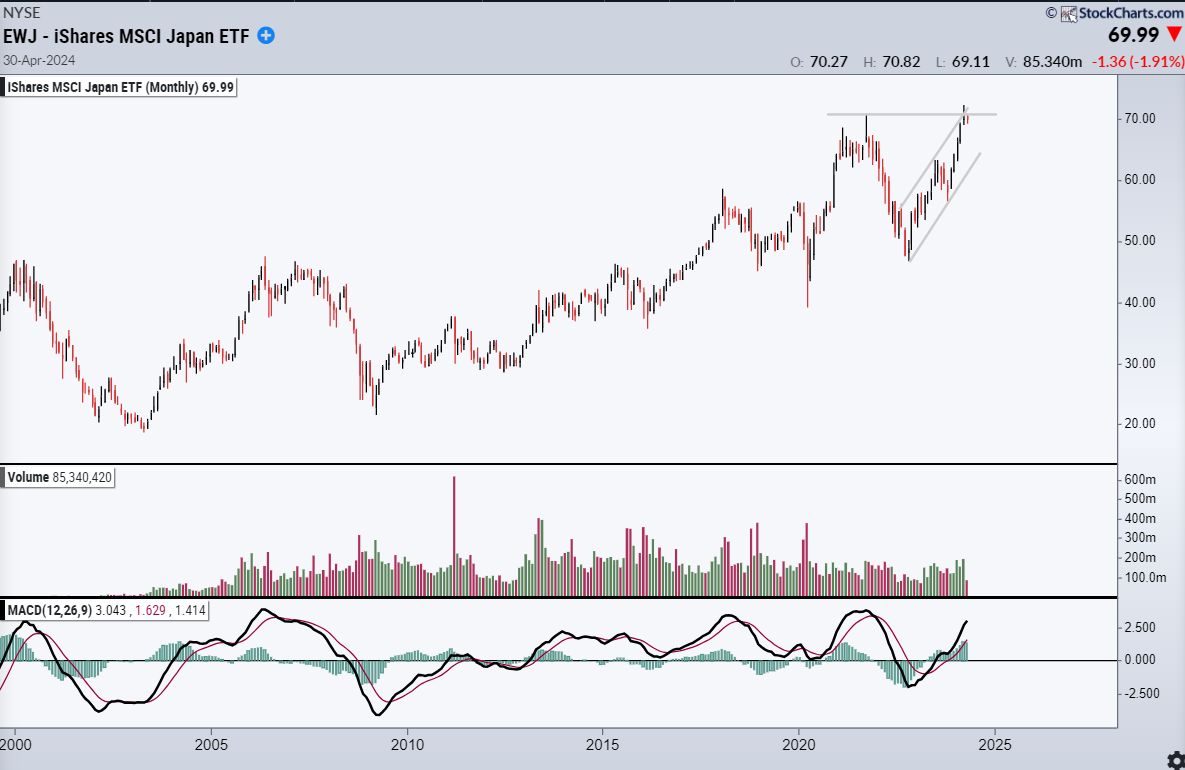
Figure 6. MONTHLY CHART OF EWJ. EWJ is testing its 2021 high, while FXI is testing an important low. If FXI shows strength and EWJ shows weakness, you could consider a long-term spread trade.Chart source: StockChartsACP. For educational purposes.
The FXI:EWJ chart in Figure 5 is particularly interesting.
- As FXI tests an important low, EWJ is testing its 2021 high (see Figure 6).
- Potential divergences are setting up in the price chart of EWJ and the spread chart of FXI:EWJ.
- This sets up a potential long-term spread trade, especially if FXI shows signs of strength, as EWJ shows weakness.
The Final Step
In my process, the final step is the sanity check. Am I falling prey to behavioral bias? Am I being dispassionate? Is my belief system compromising my impartiality? I have to conclude that in the case of FXI, that may well be so. From a personal point of view, I may have reservations about investing in China. Historically, command economies that are becoming less free tend to make for lousy investments. They are also subject to step function changes due to policy changes and wrecking risk management overlays. My firmly-held opinion may compromise my read of the FXI chart. Because of this, I will need to pay greater than usual attention to how I build my trading plan.
Note: Many topics and techniques discussed in this blog post are part of the curriculum of the CMT Association's Chartered Market Technician.
Shared content and posted charts are intended for informational and educational purposes only. The CMT Association does not offer, and this information shall not be understood or construed, as financial advice or investment recommendations. The information provided is not a substitute for advice from an investment professional. The CMT Association does not accept liability for any financial loss or damage our audience may incur.
Good Trading.
Stewart Taylor, CMTChartered Market Technician