 Here is the latest "Preview" chapter update from my upcoming book "The Complete Guide to Market Breadth Indicators - Second Edition" I am in the process of re-writing the original version using charts from StockCharts.com. As I complete a chapter (or most of a chapter) I will post it here in my blog. For future reference, just remember that all of these "preview" chapters will have the letters "CGMBI" in the title.
I've started with Chapter 5 because it contains the fewest breath indicators and charts which allowed us to experiment with the indicator building process in StockCharts.com and how the charts should look. Note that the final version of this chapter in the book will contain more indicators than presented in this "Preview" edition. I will greatly appreciate feedback in the Comment area. - Greg
Individual Breadth Indicator Format
Since this book is also to be used as a reference manual, all indicators in it are presented using a standard format which is described below. If you see that an item below is not included with the coverage of an indicator, it is because there was no information available for that particular item.
Also Known As: Many times an indicator is known by multiple names. A good example of this is the Arms Index, which is also known as TRIN and MKDS. This will also be where you can get information about very similar indicators located elsewhere in this book.
Author/Creator: Most indicators were created by someone. I have attempted to give credit when the information is available.
Data components required: These are the components of breadth data that are required to calculate the indicator.
Description: This is a brief description of the indicator which will also try to clear up any problems with any interpretation of the math.
Interpretation: Here is the generally accepted industry interpretation of the indicator, using value levels, zones, smoothing values, etc. A number of different analysts various techniques are also mentioned here.
Chart: Here is a chart that best displays the indicator. Enough data is used in the chart so that only “hand-picked” areas are avoided. There are some indicators or breadth-based systems that were beyond the capabilities for creating a chart and they will be so noted. Many times there will be a number of charts showing different interpretations or uses of the indicator from various analysts.
Author Comments: Here the author tries to offer a personal interpretation, opinion, and use of the indicator. Because the author does not use all of them, he still offers this interpretation, including some modifications and ideas for further analysis. In some instances, he will also offer a modification that he believes will enhance the indicator. A few indicators were designed for buy signals or sell signals, but not both. On these I have attempted to create the complementary indicator.
Formula: This is intended as an algebraic formula for the indicator. Here are some math symbols that will assist you:
∑ means the formula after it is accumulated or summed.
√ means the square root of the formula.
There are a number of formulae that are just too complex for this section. If I felt that was the case, I attempted to write a descriptive narrative on the formula. And in a few instances, the indicator was purely designed to be a visual display and no formulae would assist in your understanding.
StockCharts.com Symbol: This is the symbol used for the breadth indicator.
References: This is a bibliography where you can find additional information on the indicator and/or its creator. This method was preferred over a formal bibliography and at times, there are notes about a particular book or magazine article included here. Displaying them here is a much more useful location for references in my opinion.
StockCharts.com Breadth Symbology
!BI common to all Breadth Indicators from CGMBI for easy search.
NY, NA, TO denotes which exchange’s breadth data is used (NY-New York, NA-Nasdaq, TO-Toronto).
STIX two to four letters to assist in identifying the indicator (STIX-Short Term Trading Index).
D digital signal version of the analog indicator (if it is digital, the symbol has a D).
W weekly data is used instead of daily (if it uses weekly data, the symbol has a W).
P percentage is used instead of division (rare).
Example 1: !BINYHBMOD
Digital (D) version of Hughes Breadth Momentum Oscillator (HBMO) for the NYSE (NY).
Example 2: !BINADMTDW
Digital (D) version of Duarte Market Thrust (DMT) for the Nasdaq (NA) using weekly (W) data.
If the Digital version of an indicator is not familiar to you, please read this earlier article:
http://stockcharts.com/articles/dancing/2014/10/additional-and-necessary-information-about-market-breadth-.html
Chapter 5 - Advance Decline Ratio Indicators
The primary breadth indicators in this chapter are:
- Advance Decline Ratio
- Breadth Thrust
- Breadth Thrust Continuation
- Duarte Market Thrust
- Eliades Sign of the Bear
- Hughes Breadth Momentum Oscillator
- Panic Thrust
- Short Term Trading Index – STIX
There are a few additional indicators but they are derivatives of the above list.
Advance / Decline Ratio
Data components required: Advances (A), Declines (D)
Description:
This is the ratio of advancing issues and declining issues (Advances divided by Declines).
Interpretation:
Martin Zweig liked to watch this ratio over a 10 day period. He said it was very rare for the 10 day ratio to reach 2-to-1 (2.0) or more. It seems that the level of 1.8 is better with most of the data. Both levels are shown on chart 5-1.
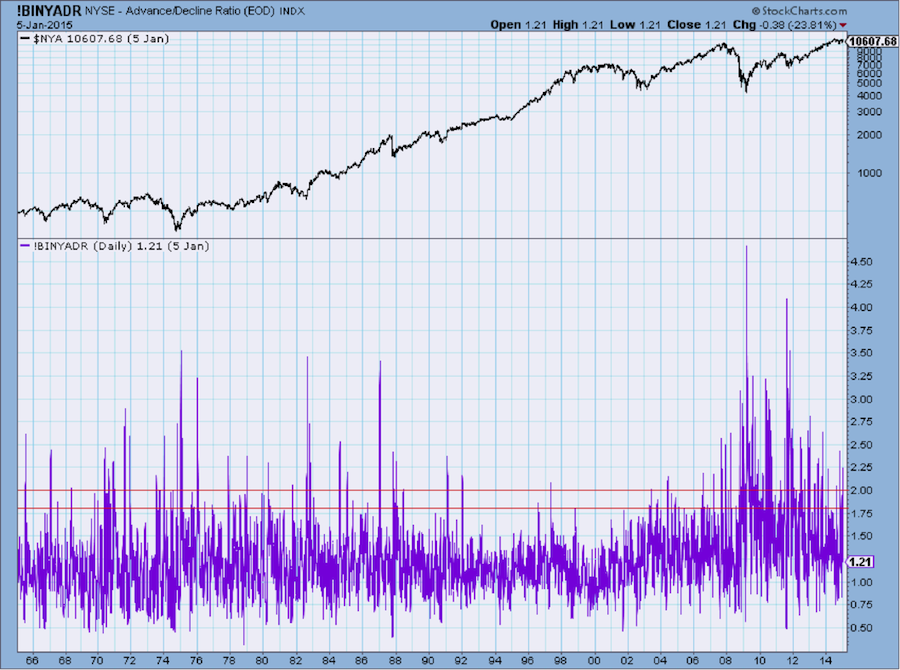
Chart 5-1- New York
Author Comments:
Ratios and differences account for many different variations of technical indicators. If you take the 10 day difference of price and plot it next to the 10 day ratio of price, you will get a similarly shaped line, only the values are different. Another interesting discovery was that the ratio of advances and declines was called the overbought oversold index by Norman Fosback (Steve Achelis used the difference of advances and declines for the overbought oversold index). Fosback says that the ten day average of the ratio is good for determining overbought and oversold areas in the market. He says that the market is oversold when the advances are at least 25% fewer than the declines (0.75 on chart 5-2). The market is overbought when the ratio shows that the number of advances is at least 25% more than the declines (1.25 on chart 5-2). Fosback states that this indicator has not tested well and is probably overrated. I added a line at 1.70, which means advances outnumber declines by about 58%. It is clear that since the low in 2009, the overbought area has increased significantly. Chart 5-2 shows that the Advance Decline Ratio seems to better reflect overbought with today’s breadth numbers. This is one of the issues I have with any overbought oversold indicator, the levels change over time, so it makes it unreliable if used in an isolated condition.
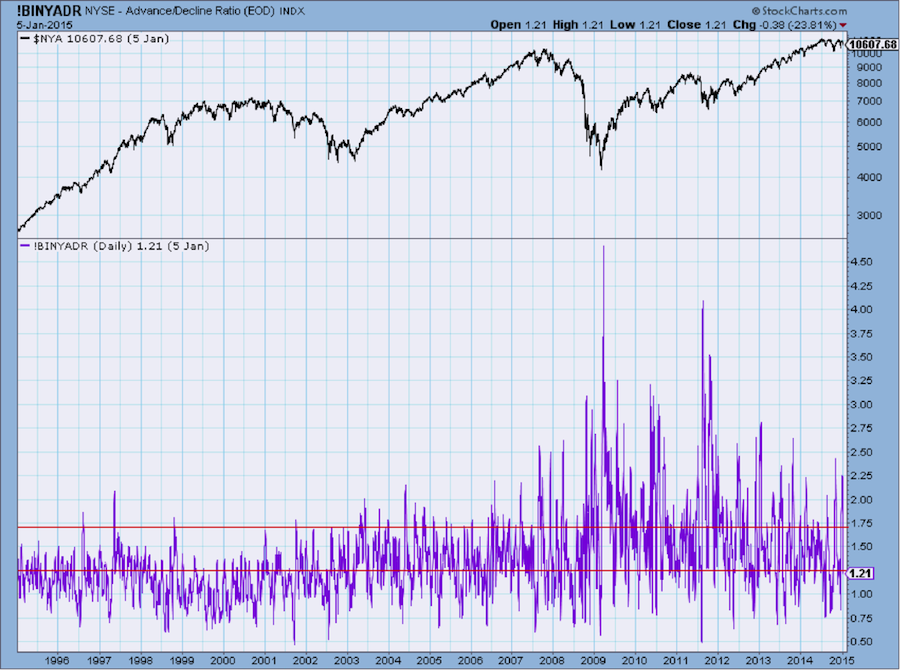
Chart 5-2 - New York
Formula: (A / D)
StockCharts.com Symbol: !BINYADR
Note this is the 10 day arithmetic average of A/D; if you want the raw ratio you can use the ratio version of the raw data symbols: $NYADV:$NYDEC
References:
Fosback, Norman G. Stock Market Logic, Fort Lauderdale, FL: The Institute for Economic Research, Inc., 1976.
Breadth Thrust
Author/Creator: Martin Zweig
Data components required: Advances (A), Declines (D)
Description:
Breadth Thrust is a 10 day exponential average of the advances divided by the sum of the advances plus the declines. A Breadth Thrust signal occurs when this indicator goes from under 0.40 to above 0.615 within a 10 day time period or less.
Interpretation:
Between 1944 and 2014 there were 13 thrusts. Martin Zweig says that strength does indeed tend to lead to greater strength. He goes on to say that people who miss the first move of an explosive rally and are waiting for a correction, often miss most of the action. Chart 5-3 shows the Breadth Thrust indicator. The red digital version quickly identifies all of the Breadth Thrust signals. Remember, the digital version just shows the signals and not all the analog noise.
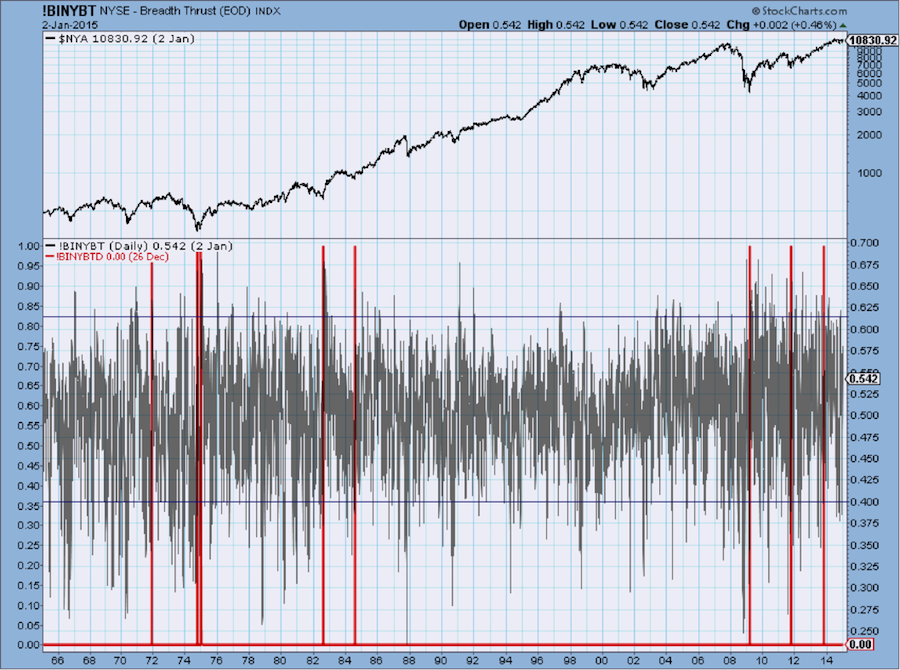
Chart 5-3- New York
Author Comments:
I wish I had a dime for every time I have seen this indicator misquoted or used incorrectly. The component that is usually overlooked is that it must go from oversold to overbought within 10 days. Once it moves from below 0.4 to above it, the signal occurs when it then moves above 0.615. If it has not done that within 10 days it has to start over from below 0.4. From 1965 to 2014 there have been only 8 Breadth Thrust signals. Here are the dates:
December 3, 1971
October 10, 1974
January 3, 1975
August 20, 1982
August 3, 1984
March 18, 2009
October 14, 2011
October 18, 2013
Those intimately familiar with the market over the last 40+ years will recognize the second and third dates as the first bottom of the giant 1973-74 bear market, the 1982 date as within a week of the beginning of the biggest bull market in history, and the 1984 date as one that coincides with a good market bottom. The March 18, 2009 was about a week after a huge bear market.
Robert Colby tested this indicator over 62 years of data and found that by using 0.659 for a buy signal and dropping below 0.366 for a sell signal worked well. However, he used a simple moving average instead of an exponential one, and it appears he did not use the 10 periods for the signal to occur. However, that does not detract from the importance of his results and further offers another use of the breadth thrust concept.
As I always do, I ask what I can do to this indicator to improve it. I can increase the days to give a signal, say to 15 days. This would give the indicator more time to reach its goal of going above .615. I can change the smoothing from 10 to 8 (to make it faster), and even change the type of smoothing from exponential to arithmetic (to make it slower). All of these may or may not yield better results. The problem here is that one is deviating from the initial concept and trying to build a better mousetrap. Martin Zweig’s concept was that the market sometimes launches like a rocket and he was attempted to define that with his Breadth Thrust. The first thing I tried was to change from using an exponential average to using a simple moving average. It didn’t provide any improvement. I think I tried a shorter period for the exponential average (8 periods) and it gave many more signals because it was able to travel from .4 to .615 quicker, however, it didn’t appear to drastically improve the original work.
Formula: (A / A + D)
StockCharts.com Formula: !BNYBT and !BINYBTD
References:
Achelis, Steven B. Technical Analysis from A to Z. New York: McGraw-Hill, 1995.
Colby, Robert W. The Encyclopedia of Technical Market Indicators. New York: McGraw-Hill, 2003.
Breadth Thrust Continuation
Author/Creator: Gerald Appel
Data components required: Advances (A), Declines (D)
Description:
Breadth Thrust is a 10 day exponential average of the advances divided by the sum of the advances plus the declines. A Breadth Thrust occurs when this indicator goes from under 0.40 to above 0.615 in a 10 day time period or less. A Breadth Thrust Continuation is when it goes above 0.615. This means the likelihood of the market continuing its upward move is great.
Interpretation:
A Breadth Thrust Continuation signal is given whenever it goes above 0.615 without the requirement for it to come from below 0.40 in ten days. That continuation signal is good until it then drops below 0.50. On chart 5-4, the upward spikes denote the Breadth Thrust Continuation signal periods with the sell signals being the downward spikes. Subsequent sell spikes should be ignored. They only come into play after an upward buy spike.
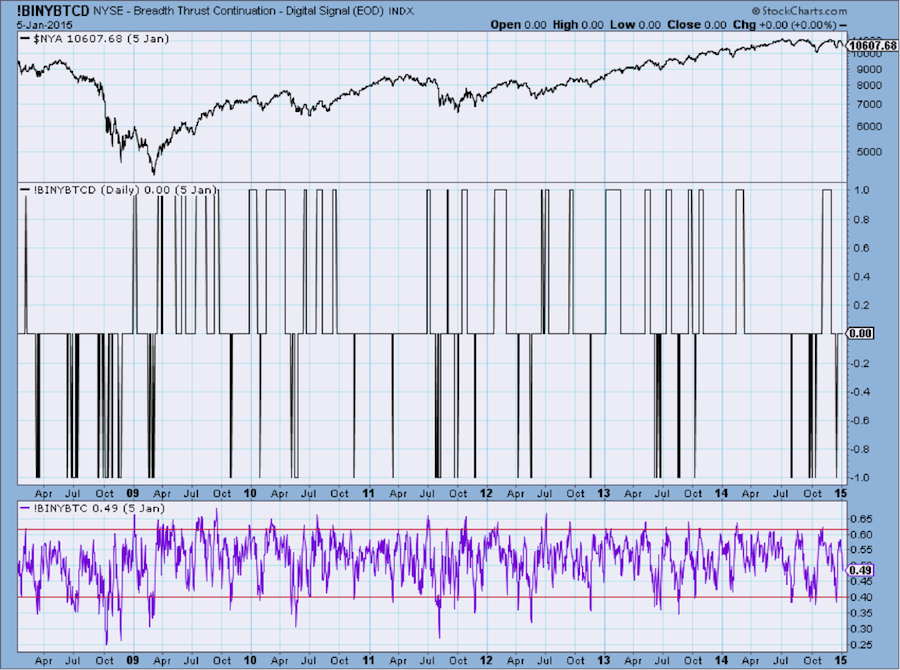
Chart 5-4- New York
Author Comments:
Tom McClellan added an additional rule stating that the continuation signal expires after 50 days, but can restart that timing (50 days) with any subsequent move above 0.615. Since 1990 there have been 31 Breadth Thrust Continuation signals.
Formula: (A / A + D)
StockCharts.com Formula: !BINYBTC and !BINYBTCD
References:
McClellan, Tom, “The McClellan Market Report,” November 19, 2004.
Achelis, Steven B. Technical Analysis from A to Z. New York: McGraw-Hill, 1995.
Colby, Robert W. The Encyclopedia of Technical Market Indicators. New York: McGraw-Hill, 2003.
Duarte Market Thrust Indicator
Book only.
Eliades Sign of the Bear
Book only.
Hughes Breadth Momentum Oscillator
Author/Creator: James F. Hughes
Data components required: Advances (A), Declines (D), Unchanged (U).
Description:
This ratio indicator uses all the breadth movement (advances, declines, unchanged) issues in its formula. It is the difference of advances and declines as the numerator and the sum of the advances, declines, and unchanged as the denominator. This sum is also the total issues. Hughes defined selling climaxes as when the declines were over 70% of total issues while advances were less than 15% of total issues.
Interpretation:
This is an oscillator that utilizes all components of issue-oriented breadth. Putting overbought and oversold zone will make this a good short term oscillator. The shorter the term that you want to work with, the shorter the smoothing you should use. Chart 5-7 uses 21 days and would be good for intermediate term analysis.
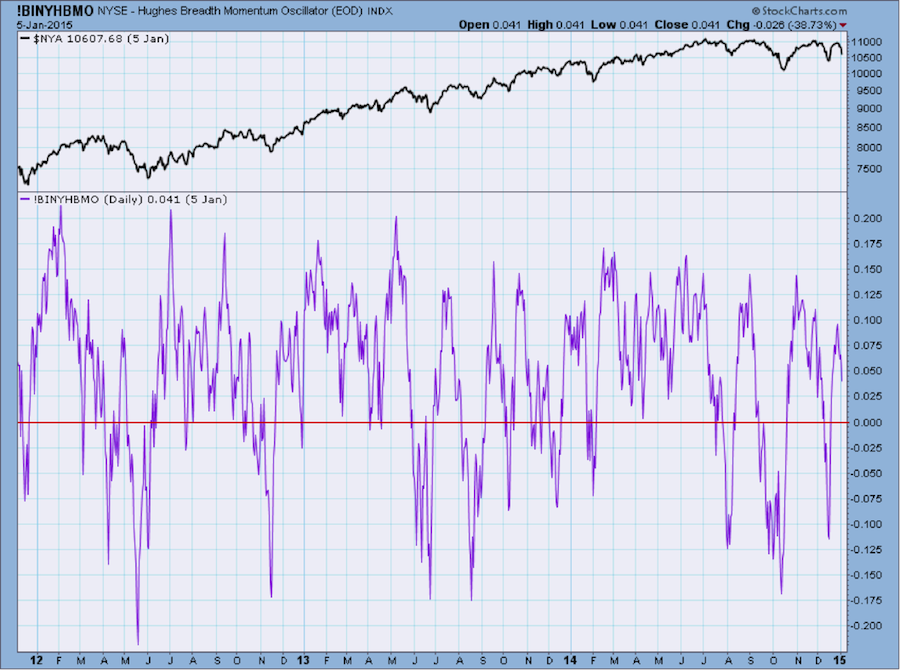
Chart 5-7- New York
Hughes Breadth Momentum % Oscillator was a creation of Robert Colby as an attempt to avoid using negative numbers and fractions and have it oscillate around 100. Overbought and oversold zones at 87 and 110 seem to work well. Colby’s modification, while not changing the concept of the indicator is a good improvement. Chart 5-8 is that modification further smoothed by 21 days (red line). The red line is the indicator you should use. It was decided to use the raw version of this indicator and show the smoothing as an overlay. This way you can see how you can change the smoothing to your desired value.
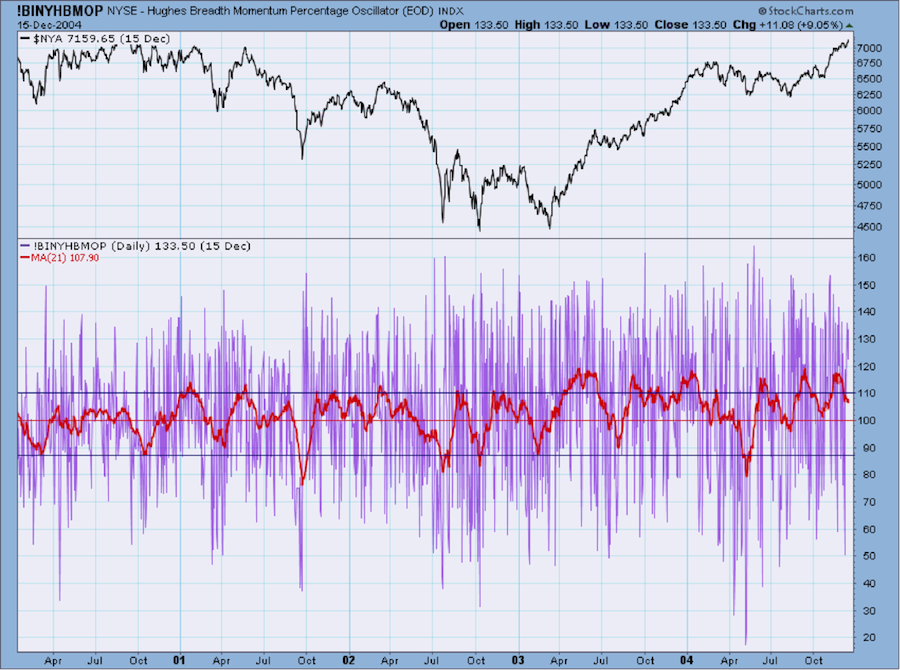
Chart 5-8- New York
Author Comments:
The sum of the advances, declines, and unchanged issues is nothing more than the total issues. This is yet another way to derive a ratio that should utilize the same overbought and oversold zones over time. If Total Issues traded is available, and one is entering this data manually, one could use that as the denominator instead.
Formula: (A – D) / (A + D + U) or (A – D) / TI
StockCharts.com Formula: !BINYHBMO and !BINYHBMOD
References:
Colby, Robert W. The Encyclopedia of Technical Market Indicators. New York: McGraw-Hill, 2003.
Dworkin, Fay H., “Defining Advance/Decline Issues,” Stocks & Commodities, Volume 8, July 1990, pp. 274-278.
Panic Thrust
Book only.
STIX – Short Term Trading Index
Book only.
STIX – With 10-Day Smoothing
Book only.
So there is the "preview" version of Chapter 5 of the revised “Complete Guide to Market Breadth Indicators.” Upon completing the electronic version of the book, we plan on offering a StockCharts.com ChartPack which will contain all of the indicators and charts in the book updated daily. I’m very excited about that prospect as it gives a book shelf life; something most technical books do not have. It is always better to learn with current data in most cases. I’m sorry, reading Edwards and Magee with charts from the 1930s is just painful.
- Greg Morris


