 It seems that technical analysts on many of the electronic boards I view occasionally want to be the first to say, “I see a head and shoulders pattern in XYZ.” All too often when I look at their prognostication, I see that it often does not come close to a head and shoulders pattern. Too many people are stuck in their software program and don’t read the old classics. Edwards’ and Magee’s Technical Analysis of Stock Trends, first published in 1948 talks about Important Reversal patterns and specifically spends a number of pages on the Head and Shoulders patterns. In my Fifth edition they start on page 50 and end on page 75. I say patterns because there is a top pattern, a bottom pattern, and a continuation (they called it a consolidation) pattern. Edwards and Magee say the head and shoulders pattern is one of the more common and most reliable of the major reversal patterns. Here are their details (emphasis is mine):
1. Left Shoulder: A strong rally, climaxing a more or less extensive advance, on which trading volume becomes very heavy, followed by a minor recession on which volume runs considerably less than it did during the days of rise and at the top.
2. Head: Another high volume advance which reaches a higher level than the top of the left shoulder and then another reaction on less volume which takes prices down to somewhere near the bottom level of the preceding recession, somewhat lower perhaps or somewhat higher but, in any case, below the top of the left shoulder.
3. Right Shoulder: A third rally, but this time on decidedly less volume than accompanied the formation of either the left shoulder or the head, which fails to reach the height of the head before another decline sets in.
4. Neckline: Decline of prices in this third recession down through a line drawn across the bottoms of the reactions between the left shoulder and head and the head and right shoulder, respectively.
5. Confirmation: A close below the neckline by an amount approximately equivalent to 3% of the stock’s price.
Source: Edwards, Robert and Magee, John, 1966, Technical Analysis of Stock Trends, John Magee Inc., Boston, MA.
As an aside, in R.W. Schabacker’s 1930 Stock Market Theory and Practice, on page 602, where he mentions the head and shoulders pattern; there is no mention of volume, even though the chart he showed (Westinghouse, 1928) shows the volume bars. And they did not comply with the volume recommendations of Edwards and Magee. Of course he hadn’t read Edwards and Magee since it was published 18 years later.
Now you hopefully know what I mean when I see all sorts of head and shoulders calls, when in fact, they are not even close to meeting the proper definition. I think I can blame software charting and analysis programs for this; people are just not studying the classics. Or there is just some sloppy guesswork going on. I’m not exactly sure what the thrill is to announce that you see something to strangers.
Anyway let’s move on with the head and shoulders pattern. In classical technical analysis many chart patterns also offer price projections. With the head and shoulders the projection is the distance from the top of the head to the neckline, which projects price in the direction of the neckline break. Chart A shows a pattern with pink lines for the distance from the head to the neckline and then from the break down below the neckline to project the price. I have not seen any studies as to the viability of classic chart pattern projections. In my Candlestick Charting Explained, which was a giant research project almost 25 years ago, I produced thousands of statistics on the viability of candle patterns. Many of which, were quite poor; and I stated such.
Chip and I held a contest via Chip’s blog to award the StockCharts.com subscriber with 3 extra months for finding the “perfect” head and shoulders pattern. I’ll have to admit it was a little disappointing to only receive 11 charts from only 7 people. While I cannot begin to guess why there were not more submissions, I can correlate this with my effort to find a perfect pattern, of which I could not, and that is why we held the contest. The perfect pattern is also a rare pattern. We had a few suggestions that were quite close but usually a component was missing or not as strong as the winner. I even contacted my friend Charles Bassetti who is the current editor and coauthor of the Edwards and Magee book (Charles was a student of John Magee in the 1960s). To my initial surprise, but later understanding, he suggested ignoring the volume. The example in this article was submitted by Worapak Jitpakdee and is as close to a “perfect” one as I have seen. Congratulations to Worapak Jitpakdee; hopefully in the comments section he will share with us how many charts he had to look at and how much time it took. Notice how the volume declines throughout this period of distribution and how it picks up significantly on the breakout. Classic! And rare!
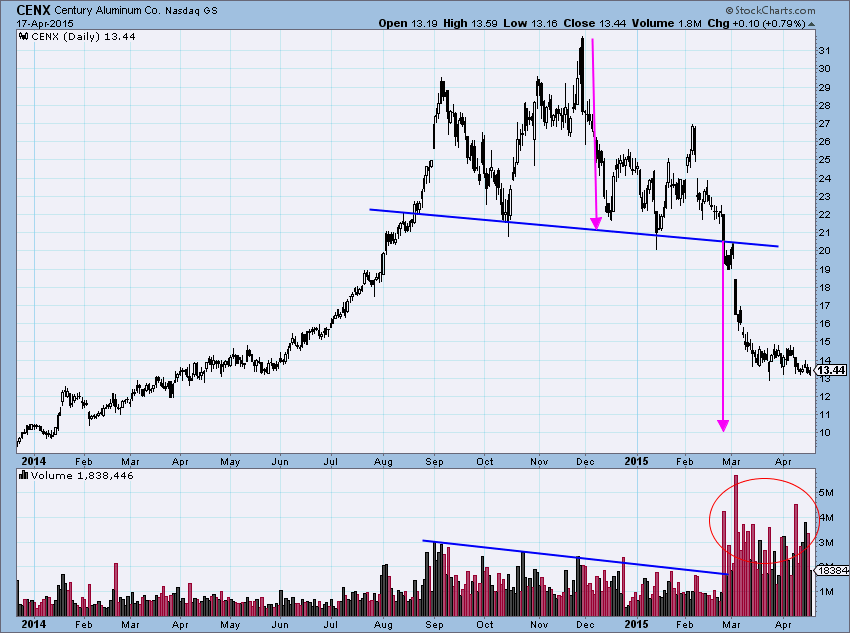
Chart A
Personally, to help validate a pattern I want to see the trend leading up to the start of the pattern to be just as long as the pattern itself. In the case of a head and shoulders pattern, that preceding trend must be as long as the distance from the head to the neckline. Chart B shows this with the red lines. If you recall in an earlier article “Are you Using Chart Patterns Correctly?” I stated that often I see reversal patterns picked in total isolation. This is wrong, a reversal pattern must reverse something, so therefore must have an appropriate trend preceding it. Therefore I have added my personal requirement that the preceding trend must be at least as large at the head to neckline distance. This requirement is especially important when the volume does not play along. Think of it as a substitute for uncooperative volume or an issue with no volume data. I believe any supporting information will assist in the quality of the pattern especially if all you have is the price data simulating the head and shoulders pattern.
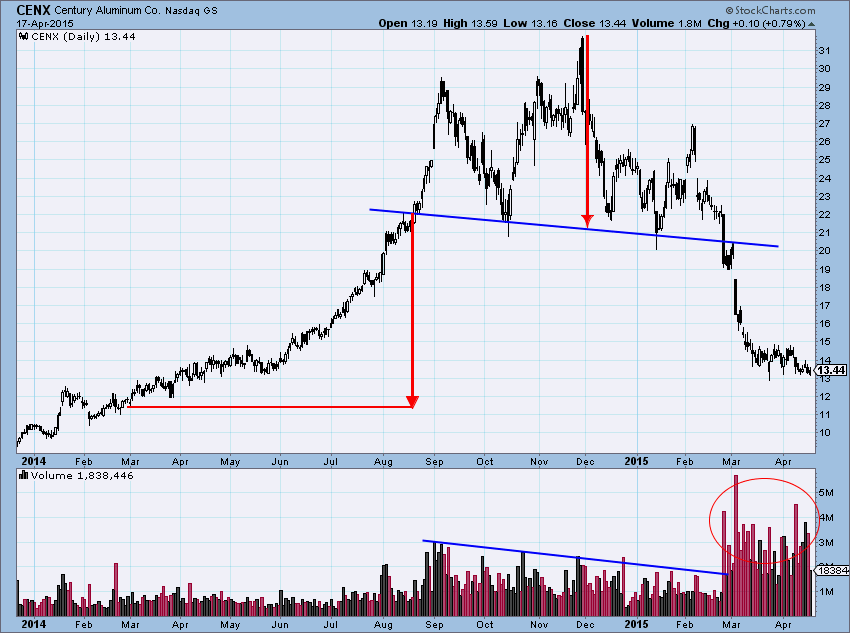
Chart B
So now if you see a chart of a head and shoulders pattern and there is no mention of volume you might ask yourself why. Personally, if looking at individual stocks, then the volume must be there and must be close to what is expected. Does this mean I ignore head and shoulders patterns on indices where there is no volume or the volume is unreliable? No, but I do make a mental note of it. Furthermore classic chart patterns are only good for confirmation or used in association with more definitive measures in my opinion. Like Japanese candlesticks, I would never trade them in isolation, plus they are too subjective. Finally, while I’m sure you guessed what the title of this article was all about, you might have missed the point of cleaning up your pattern reading.
I will be out of town next week. I’m speaking at the NAAIM conference in Newport Beach, CA.
Trade properly,
Greg Morris


