 CH 6 Advance Decline Miscellaneous
The breadth indicators in the section could not be categorized as using the difference or the ratio of the advances and declines, so they are in the miscellaneous section.
Advance Decline Miscellaneous Indicators
Advances / Issues Traded
Advance Decline Divergence Oscillator
Advance Decline Diffusion Index
Breadth Climax
Declining Issues TRIX
Disparity Index
Dynamic Synthesis
Unchanged Issues
Velocity Index
Advances / Issues Traded
Also known as: Schultz AT
Author/Creator: Schultz? See below for more information.
Data components required: Advances (A), Total Issues (TI)
Description: This indicator looks at only the advancing issues relative to the total issues, calculated as a ratio.
Interpretation: Schultz did not use total issues, but summed the advances, declines, and unchanged issues which would yield the same result. Chart 6-1 shows that in its raw from (unsmoothed), this would be a difficult indicator to use. However, if you put threshold values on the oscillator, you can see it helps identify the spikes relative to market action.
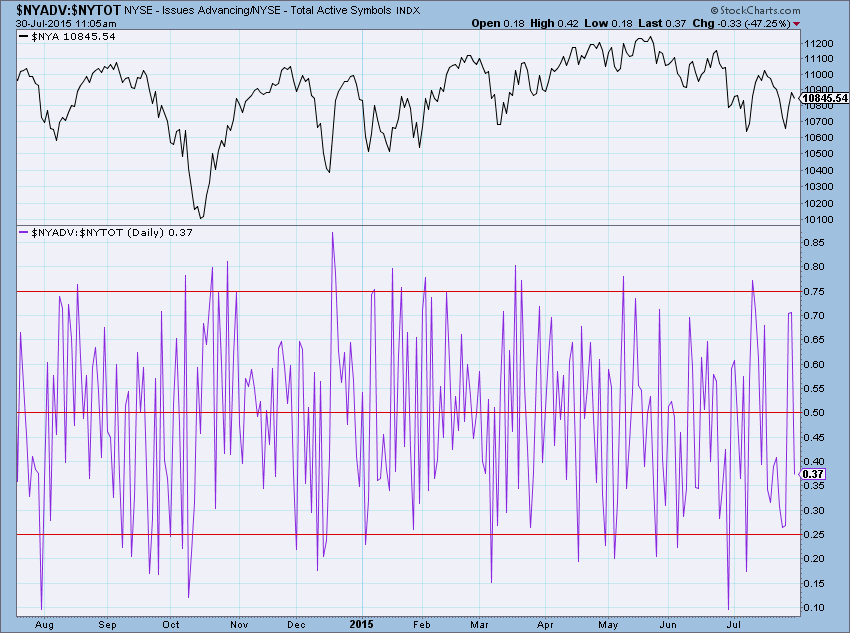
Chart 6-1
Author Comments: Other than a brief reference in a very old CompuTrac software manual, I have not been able to find out any more about this indicator or about Mr./Mrs. Schultz. I spoke with Tim Slater, the founder of CompuTrac and he was gracious enough to look through his old files to see if he could find any reference. Tim called me back a few weeks later and was of the belief that the indicator was obtained from Dunn and Hargitt, however he could not uncover any further information.
2015 Update: George Schade is one of those exceptionally bright people who knows how to research properly; he read this book some years ago and decided to find out who Schultz was. He wrote a paper that you will enjoy which answers the question I had about Schultz. I’ll publish it soon along with some personal experiences I have had with John W. Schulz.
Like many indicators, smoothing this one will greatly enhance its usefulness. It is apparent from chart 6-2 that the advancing issues will lead almost all market up moves. This should come at no surprise, but when it does not happen is when to pay attention.
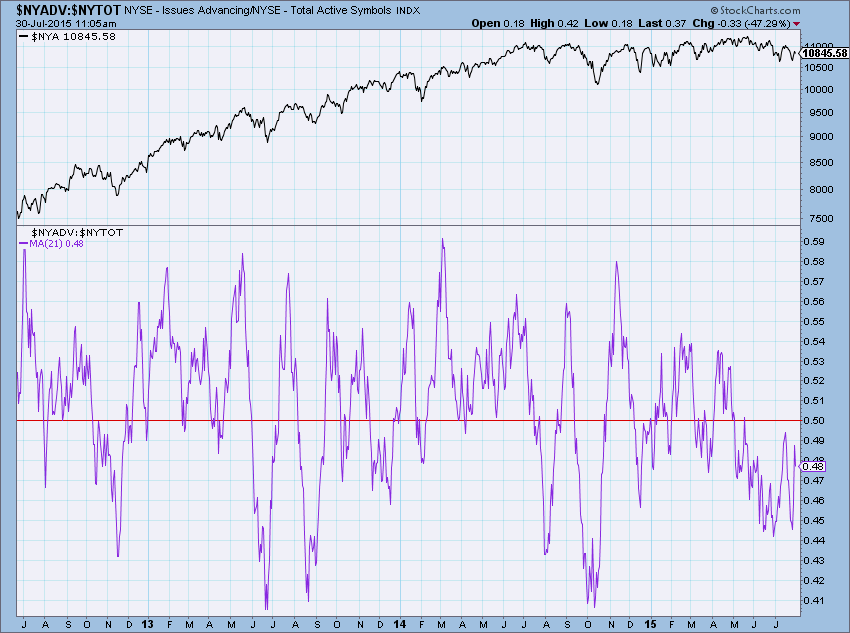 Chart 6-2
Formula: (A / TI)
References: 1984 CompuTrac software manual.
Advance Decline Divergence Oscillator
Author/Creator: Arthur Merrill
Data components required: Advances (A), Declines (D), Unchanged (U) Market Index (MKT).
Description: This was Arthur Merrill’s Disparity Index; an attempt to see how a breadth indicator performed relative to a market index. He stated that he did not like the subjectivity of visually looking at a chart of each one. Here is what he said: “The comparison isn’t easy, since the market average is in dollars, and the advance decline line is an accumulation which could start anywhere.” He made the comparison into an oscillator. Rather than subtracting one index from the other, he calculated a simple least squares regression line. The calculation is the same as a least squares trend, except the ordinal statistics are the Dow Jones Industrial Average, and the abscissa statistics are the advance decline accumulation (advance decline line). To make the oscillator, he compares the Dow with the least squares line, and then calculated the percentage that the Dow was above or below the line. I used the NYSE Composite in these examples.
Interpretation: If the Advance Decline Divergence Oscillator is positive, the NYSE Composite is pulling ahead of the Advance decline Line. Assuming a better breadth indicator over prices, a positive value is bearish and a negative value is bullish. Art Merrill also used signals based upon 2/3 of a standard deviation. It was bullish when it was below -0.7 and bearish was when it was above +5.4. Chart 6-3 is a modified version of Art Merrill’s Advance Decline Divergence Oscillator. It normalizes the market price data and also the advance decline data, then looks at the difference between the two. A period for normalization of one year (252 days) was used. While considerably different than Merrill’s work, the concept is identical. Chart 6-3 clearly shows the concept that Art Merrill was talking about. The top plot is the NYSE Composite Index and the bottom plot is the AD Divergence Oscillator.
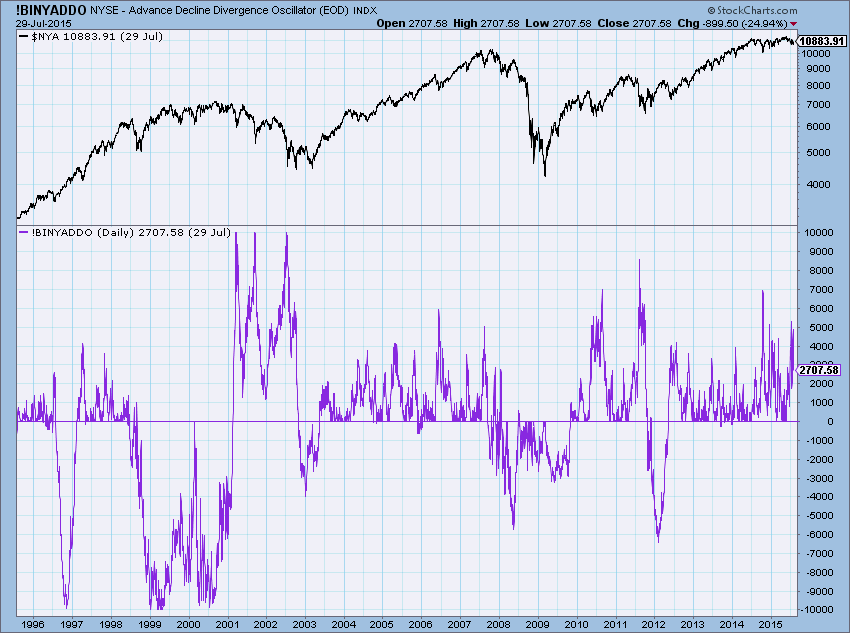 Chart 6-3
Author Comments: You can see from chart 6-3 that whenever the advance decline line is stronger relative to the Dow Industrials, the oscillator is above the zero line. It is apparent from this indicator that the advance decline line is a very early warning indicator of future market direction, especially at market tops. And this is good because most indicators are better at identifying market bottoms.
Arthur Merrill also included in the advance decline calculation Edmund Tabell’s adjusted AD value by dividing the difference between advances and declines by the unchanged issues. Edmund Tabell figured that if the unchanged issues were low, then there was a great deal of conviction in the market.
Formula: ∑ ((A – D) / U) / MKT
StockCharts.com Symbol: !BINYADDO
References:
Merrill, Arthur, “More Trend Direction.” Stocks & Commodities, Volume 6, June, 1988, pp. 218.
Merrill, Arthur, “Fitting a Trendline by Least Squares.” Stocks & Commodities, Volume 6, July, 1988, pp. 254.
Merrill, Arthur, “Advance Decline divergence as an oscillator.” Stocks & Commodities, Volume 6, September, 1988, pp. 354.
Advance Decline Diffusion Index
This indicator will be in the book.
Breadth Climax
Author/Creator: Gerald Appel
Data components required: Advances (A), Declines (D), Unchanged (U).
Description: A buying climax is when the market puts together no more than two consecutive days having 1000 or more advancing issues. A selling climax is when the following conditions are met:
1. At least 70% of the total issues are declines.
2. No more than 15% of the total issues are advances.
3. Less than 150 issues are unchanged.
Interpretation: When either the buy criteria or the sell criteria are met, a Breadth Climax has occurred. This means that the buying or selling has reached an excess and the market should reverse its previous trend.
Author Comments: Gerald Appel developed this system over 30 years ago. The breadth numbers have changed dramatically since then. I took the basic concept he was using and found a better set of parameters. A buying climax occurs when there are two consecutive days where the advances are greater than 65% of the total issues. A selling climax is when the following conditions are met (only slightly different that Appel’s):
1. At least 75% of the total issues are declines.
2. No more than 15% of the issues are advances.
3. There are less than 150 issues unchanged.
Chart 6-5 shows the buying climaxes as upward spikes and the selling climaxes as downward spikes.
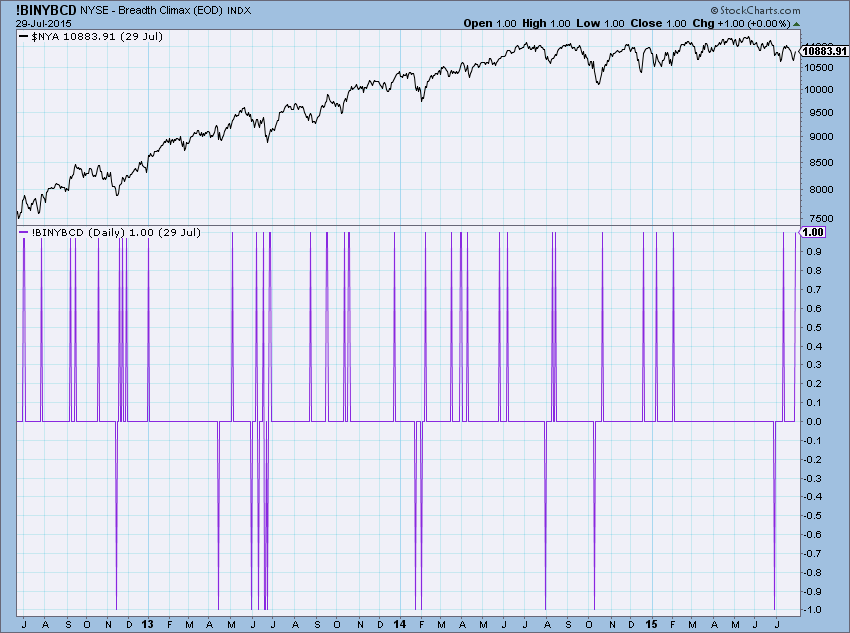 Chart 6-5
Chart 6-5 fairly well identifies periods in the market when sharp declines or advances have occurred. The long period between 1988 and 2001, without any buying climaxes falls in line with a number of other indicators similar to this one, such as Martin Zweig’s Breadth Thrust. In a bull market, after it gets underway, there are few, if any, buying climaxes.
StockCharts.com Symbol: !BINYBCD
References:
Appel, Gerald. Winning Market Systems. Greenville, SC: Traders Press, 1973.
Declining Issues Trix and Advancing Trix
These indicators will be in the book.
Disparity Index
This indicator will be in the book.
Dynamic Synthesis
This indicator will be in the book.
Unchanged Issues
This indicator will be in the book.
Velocity Index
Data components required: Advances (A), Declines (D), Unchanged (U).
Description: This indicator measures the unchanged issues and advancing issues relative to total issues. It takes one half of the unchanged issues and the advancing issues and then divides that sum by the total issues.
Interpretation: Moves in the Velocity Index greater than +10 and -12 normally indicate continued movement in that direction. Keep in mind that this is not much different than the advances as a percent of total issues. The addition of using one half of the unchanged issues would imply that this indicator would be coincident at market tops as the advancing issues dry up. Chart 6-16 shows the Velocity Index.
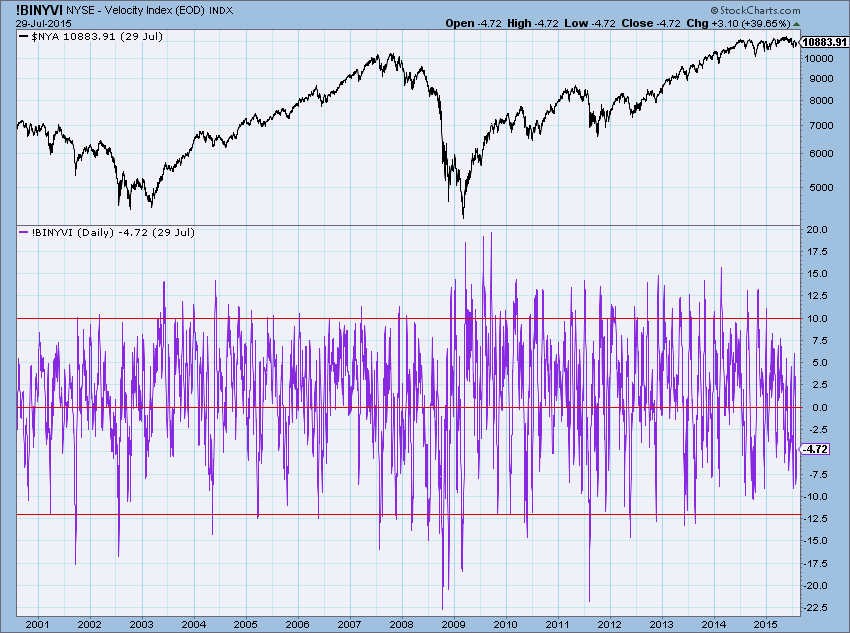 Chart 6-16
Author Comments: I put his indicator into a breadth formula package I created over 25 years ago. I cannot find any additional information on it or who created it. It wasn’t me. Heck, I can’t even remember where I first discovered it.
Formula: (U/2 + A) / (A + D + U)
StockCharts.com Symbol: !BINYVI
References: Morris, Greg, “Indicators and Trading Systems Software,” G. Morris Corporation, Dallas, TX.
Update on The Complete Guide to Market Breadth Indicators
We have completed the first 6 chapters which contained 89 charts. We have the following to go:
Chapter 7 – New High, New Low Indicators 28 charts
Chapter 8 – Up Volume, Down Volume Indicators 26 charts
Chapter 9 – Composite Indicators 37 charts
Chapter 10 – The McClellan Indicators 4 charts
Chapter 11 – Non-Internal Indicators TBD
Chapter 12 – Conclusions
Appendix A – Indicators and Trading Systems – What’s the Difference?
Appendix B – Time Frames for Analysis
Appendix C – Miscellaneous Information
Bibliography
Index
Trade well,
Greg Morris


