 My good friend George Schade, the lawyer, the excellent technical analyst, the market historian, the superb researcher, and the one who has dampened a few of my brusque writings into less offensive prose has given me permission to reproduce an article he wrote in 2011 about an indicator I had in my “The Complete Guide to Market Breadth Indicators” book called the Schultz AT (you saw it in the last article). It is presented below with some minor editing on my part to reduce the number of paragraphs and removal of the Endnotes. I also enlarged the chart significantly. I have inserted a few notes which begin with: Note. Any errors perceived or real are my fault.
SCHULTZ AT - THE MISNAMED INDICATOR
BY GEORGE SCHADE JR., CMT
Tracing an indicator’s origin is an exciting hunt. Gregory Morris and Robert Colby have written about the “Schultz AT” measure of market breadth. Morris asked who Schultz was but did not get a complete answer, while Colby suggested that AT had been named after John W. Schulz (no “t” in the surname). AT’s formula is simple, namely, the total number of advancing issues is divided by the number of total issues traded. The non-accumulated ratios are charted daily or smoothed preferably with a short term moving average. Neither Harry D. Schultz nor John W. Schulz originated the AT indicator, but both popularized it. Harold M. Gartley created AT and wrote about it in 1935.
I. John W. Schulz
John W. Schulz was an early member of the Market Technicians Association (“MTA”). In 1979, he received the MTA Annual Award. According to Ralph Acampora, Schulz was a primary drafter of the charter MTA Constitution. In 1972, Schulz wrote the MTA’s Principles and Policies document associated with the constitution. The Market Technician Association Journal (now the Journal of Technical Analysis) reprinted an article in 1979 written by Schulz concerning the Kondratieff Wave.
Between 1959 and 1976, Schulz worked for at least three Wall Street firms. At the last firm, as Managing Director of Brean Murray, Foster Securities, Inc., he wrote a market letter entitled The Technical Review. From October 1, 1959, to March 15, 1976, he wrote a column for Forbes magazine. The column was initially entitled Technical Perspective and later Technician's Perspective. Schulz was part of the highly regarded group of writers at Forbes that included Heinz H. Biel, Lucien O. Hooper, and Sidney B. Lurie.
In 1962, Schulz wrote The Intelligent Chartist which is available in the MTA Library. Note: I just checked and Amazon has it for $499; my copy is not for sale. In the book’s last section, Schulz described the data he analyzed to measure market movements. He considered the number of daily advances, declines, and unchanged - the issues traded - to be “perhaps the most enlightening of the” daily market numbers.”
He wrote: “In my opinion, the daily number of issues advancing is more useful by far. This part of the market is shown … as a percentage of all issues traded for the day. I make no further adjustment to this (or any other) figure [such as moving averages]; but the raw data seem preferable to me; despite the wide variations over brief periods, the trend of the variations themselves becomes quite clearly apparent. A similar line could be plotted for the percentage of issues declining. But this, too, would add to the clutter; and anyway, the issues-down factor is more or less implicit in its opposite, - the issues-up line.”
Schulz called the percentage of daily advances to issues traded the “issues- up line.” Because the “issues-up line alone can serve as an early indicator of changes in trend direction,” he compared it to the Dow Jones Industrial Average to detect divergences.vi For this purposes, he advised using the issues-up line together with volume and the cumulative advance-decline line. Schulz used AT, but he was not its originator. He conceded that “there is nothing especially original about my approach to this material; and the data themselves have long been recognized as useful and significant and are in the toolkit of most careful technicians.” Note: See short piece about my time with John Schulz near the end.
II. Harry D. Schultz
For over 45, Harry D. Schultz produced the “International Harry Schultz Letter.” Reportedly, he published the last issue in December 2010. He frequently wrote on financial panics and crashes. An interview held on July 11, 2010, is enlightening. In 1962, Schultz wrote Bear Market Investing Strategies in which he described the “percent of advances index” indicator as follows (the 17th indicator on his list of 18): “Percent of advances index. Divide the daily advances by the issues traded. This is another way of approaching the overbought–oversold problem. A 10-day moving average is probably best. In charting it, you’ll discover how to interpret it, for the extremes become obvious cues. When it falls below 40%, it’s a signal of weakness ahead.”
The “percent of advances index” is the same as the “Schultz AT” indicator. Most likely this description is the basis for naming the indicator after Harry D. Schultz. Interestingly, John Schulz and Harry Schultz published about AT the same year - 1962. Unlike Schulz, Schultz smoothed AT with a 10-day moving average. In Bear Market Investing Strategies, Schultz wrote about the stock market volume work of Harold M. Gartley, “a great technician in the 1930s.” Gartley closes this wonderful story because he originated AT.
III. Harold M. Gartley (1899-1972)
In 1966, Schultz edited what has become a primary source for historical research, namely, A Treasury of Wall Street Wisdom. The book contains the chapter on volume found in Gartley’s classic book Profits in the Stock Market. Schultz’s knowledge of Gartley’s work is significant because Gartley created a market breadth indicator that was the ratio of daily advances divided by the number of total issues traded, the same indicator that John Schulz and Harry Schultz described almost 30 years later. Gartley received a degree in Commercial Science and a Master's Degree in Business Administration from New York University. Beginning in 1912, he worked in Wall Street as a stockbroker, adviser, analyst, instructor, and financial public relations counsel. By 1932, he was an adjunct lecturer at the Columbia Business School when Benjamin Graham taught there.
Gartley began studying breadth of the market in 1931. A year later, in a Barron’s article, Gartley included a chart that showed daily advances and declines. The article did not describe or show the ratio of advances and total issues traded. AT appeared in chapter 15 of Gartley’s Profits in the Stock Market published in 1935. Chapter 15, entitled “Breadth-of-the-Market,” headlined: “Although this subject has been studied by many market students, with the exception of the author’s work, we know of no published material.” It is possible that the market breadth work of Leonard P. Ayres and James F. Hughes was either not fully known to Gartley or as comprehensive as he may have desired.
Gartley wrote that the “reason we study the general statistics of the market is to obtain what the old time trader called ‘a better feel of the market’.” He believed in analyzing breadth of the market numbers because ”the value of this type of study cannot be overemphasized as a timing device providing considerable aid to the technical student. It is believed that no single branch of stock market trend research will yield greater results. This contention is based on the belief that the growth and deterioration of bullish and bearish market sentiment is clearly reflected in the general market statistics, providing that adequate analysis is made.”
The market-derived statistics are the same used today, namely:
1. Number of issues traded
2. Number of advances
3. Number of declines
4. Number of prices unchanged
5. Number of new highs
6. Number of new lows
7. Total volume
8. Ratio of trading in the 15 most active stocks to total volume
Gartley’s market letter as well as other financial publications provided the data. The Wall Street Journal was reporting New York Stock Exchange advances, declines, and unchanged by February 19, 1932, and so was Barron’s by May 1, 1933. Gartley emphasized that “these statistics must be considerably refined, in order to be of any practical value.” Even “after a year or two, it was found that considerable refinement was necessary, and even after several years of experience no arrangement of the data has been found which reliably reflects each successive intermediate turning point.”
Refinement led to AT. According to Gartley: “Experience with the raw data … soon showed that it had to be somewhat refined if it was to be useful. So the idea was conceived to reduce all the data to some uniform basis, and, instead of using just the number of advances and declines, a ratio was prepared wherein the percentage of the advances and the declines, as compared to the total issues traded each day, was computed.”
In chapter 15 of Profits in the Stock Market, Gartley showed the results of using a 7-day moving average of the ratios of daily advances and declines compared to the number of total issues traded. He found that when the 7- day moving average of the ratio of advances to total issues traded exceeds 60%, it is time to consider selling stocks, and when the 7-day moving average of the ratio of declines to total issues traded rises above 60%, it is time to buy stocks especially if a decline has been in progress for some time. Gartley found these indicators useful to determine intermediate trend reversals, but they also developed some rather consistent minor trend signals. A nominal distinction is that Gartley used a 7-day moving average while Harry Schultz suggested a 10-day moving average.
In 1981, the Market Technicians Association Journal reprinted an article that Gartley wrote in August 1937, which essentially was chapter 15 of Profits in the Stock Market. The article is entitled Breadth of the Market Trends. Gartley’s AT is shown in Chart 1 below as it appeared in the Journal’s article. Line 1 shows the number of unchanged in June and July, 1932. Line 1A shows the ratio of unchanged divided by total issues traded in August through November, 1932. Line 2 shows the number of advances in June and July, 1932. Line 2A shows the ratio of advances divided by total issues traded in August through November, 1932. Lines 3 and 3A show the Standard Statistics Daily 90-Stock Index for comparison purposes. Lines 4 and 4A show the same for daily declines in the same time periods.
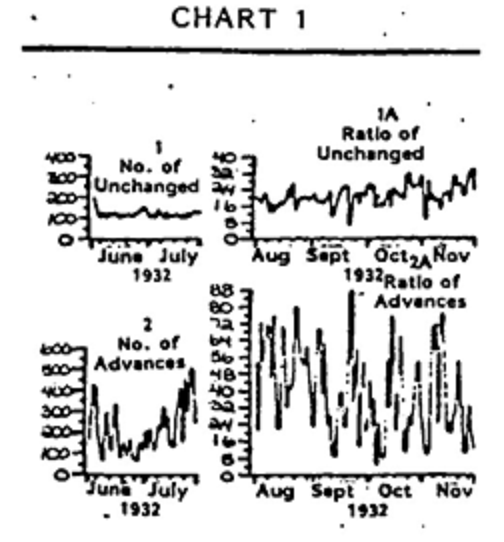
Chart 1. The First Showing of Advances/Total Issues Traded.
Note: I split the original graphic into a top section and bottom section so I could enlarge them.
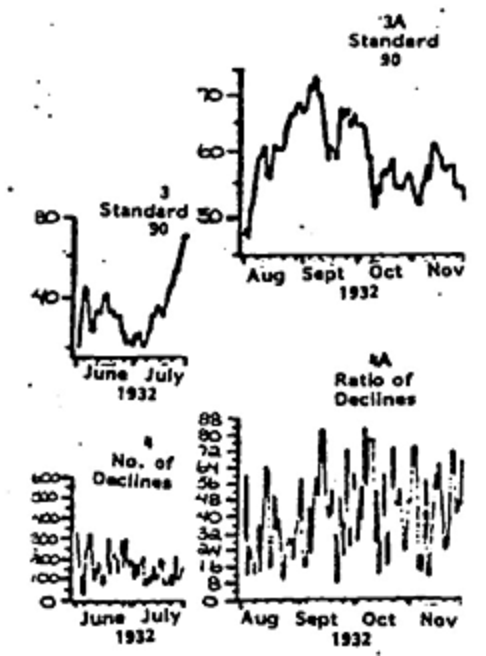
Chart 2 in Gartley’s article shows the 7-day moving average of both advances and declines compared to total issues traded between June, 1932, and April 1937. Chart 2 is not shown here because its reproduction is not as clear as that of Chart 1.
IV. Conclusion
Harold M. Gartley originated the Advances/Total Issues Traded as well as the Declines/Total Issues Traded indicators. John Schulz and Harry Shultz popularized AT but cannot be credited with its invention. Morris’ inquiry is answered. Harold M. Gartley originated Advances/Total Issues Traded as Harry Shultz and John Schulz used it fifty years ago. And finally, to borrow liberally from Shakespeare’s Romeo and Juliet:
“What’s in a name? That which is called Schultz AT
By its proper name Gartley AT would be as true.”
Thanks George.
Back with Greg - In the early 1990s, Norm North and I had created a simple Point and Figure charting software (APEX) that downloaded daily data from Warner Computer. I sent a number of copies out to my short list of folks I knew used Point and Figure, one was John W. Schulz; the same John Schulz mentioned by George and also a founding member of the MTA (Market Technicians Association). John Schulz called me one day to thank me and asked if I would help him get the software going as he claimed he was completely not at home with a computer. Over the next few months we spoke a couple of times a week, usually in the evening and eventually I had him set up to download data every evening, chart it with the box size and reversal period he wanted, and then print it. He was a true gentleman 100% of the time. We talked about the markets often – he had a fascinating understanding of the markets. One day I received a large package and in it was his book, “The Intelligent Chartist,” along with many hand-drawn point and figure charts. He asked me if I would like to be on his fax list. I said yes and for a couple of years until he died I received hundreds of hand-drawn charts. Not once did I ask him why he did not use my software.
It is too difficult to publish on a consistent schedule with so many nice days for golf; so I'm going to try to publish about 4 articles per month and will publish them when they are ready. Please sign up for email notifications and it will be easier. And as always, keep those questions coming via the Comment section. Thanks.
Trade by Understanding the Past,
Greg Morris


