 In a previous article entitled, “Zahorchak Measure” I introduced a process that was one of the first I read about back in the 1970s that hooked me on technical analysis. The article generated a lot of interest so with this article I’m going to add more detail on the Zahorchak Measure and also a couple of alternate versions that I created a hundred years ago.
Let’s start off with a review of the Zahorchak Measure in considerable detail. Zahorchak states that there is often no correlation between the price of a stock and its fundamentals. He further states that fundamentals will tell you whether or not investors will be attracted to a stock. Zahorchak clearly believes that the markets move regularly from bull market periods to bear market periods. These switches from bear to bull and back again are not due to economic conditions but a switch in investor psychology from optimism to pessimism. He also believes that stocks move in herds and have a tendency to go up and down together in these bull and bear markets, with just enough exceptions to prove the rule. He was really big on spending lots of time on selecting a shopping list of stocks as potential purchases; no less than 25 and no more than 100. He preferred cyclical stocks that moved well with bull and bear periods.
“Only the market itself can tell you what to do. Everything else is irrelevant. While the irrelevant items tell you what the market ought to be doing, this may or may not be what it actually is doing.” To determine what the market is doing compute the following:
1 - 5 week moving average of the Dow Industrials
2 – 15 week moving average of the Dow Industrials
3 – 40 week moving average of the Dow Industrials
4 – 15 week moving average of the NYSE advance decline line.
Note: Rereading the book for this article I realized at some point in the last 4 decades I had switched to using the NYSE Composite average instead of the Dow Industrials. I think it was because the advance decline line uses the NYSE stocks, so figured using the index of those stocks made more sense. I seriously doubt it makes a difference.
Zahorchak then discusses the timing of the market because the primary trend tells you when to buy stocks and when to avoid them, however, it does not tell you when to sell them. Once stocks have been bought, their trend action tells you when to sell. Note: Keyword here is their. He then goes into the four basic market conditions.
1 – Bull market.
2 – Sideways periods in a bull market. He goes into considerable discussion on why investors make terrible decisions during these types of markets.
3 – Bear market.
4 – Again, an uncertain period within a bear market. Again, much discussion about all the mistakes investors make during this period.
In the table A below, +40 or –40 mean that the price is above (+) or below (-) the 40 week average. Up means the moving average is moving higher each week. Down means the moving average is moving lower.
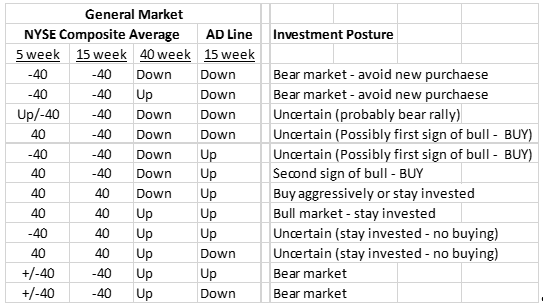
Table A
The timing of the purchase and sale of individual stocks is provided in Table B. The AD Line is not used here since there is no advance decline information on an individual stock.
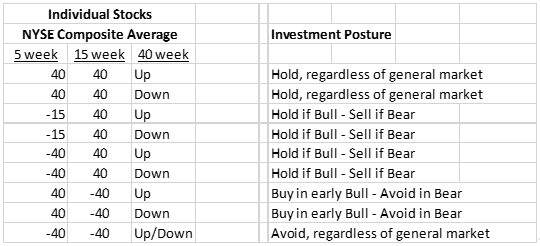
Table B
When StockCharts.com’s Bill Shelby and I started to program the Zahorchak Measure into StockCharts.com’s format so it would be included in the symbol catalog, we had trouble getting started. The reason was actually my fading memory as I had tinkered with the Zahorchak Measure over the decades and in the process thought I had made a few changes and improved it somewhat. Once I realized I was giving Bill the code to the “tinkered” version and sent him the correct code we were off and running. After reviewing both sets of code I decided to also include my alternate version.
I had noticed that during market bottoms and especially tops there was a lot of noise in the measure; while still yielding reasonable signals. This generally happens when a short term average is dancing with a long term average, which in this case is the 5 week versus the 40 week. So I simply removed the buy and sell requirements for those two relationships and it removed much of the noise without affecting the timeliness. Chart A below shows the weekly modified ZM for the past 35 years. You might notice that with the 5/40 relationship removed the ZM now only moves from +10 to -10. Chart B shows the weekly modified ZM for the last 10 years.
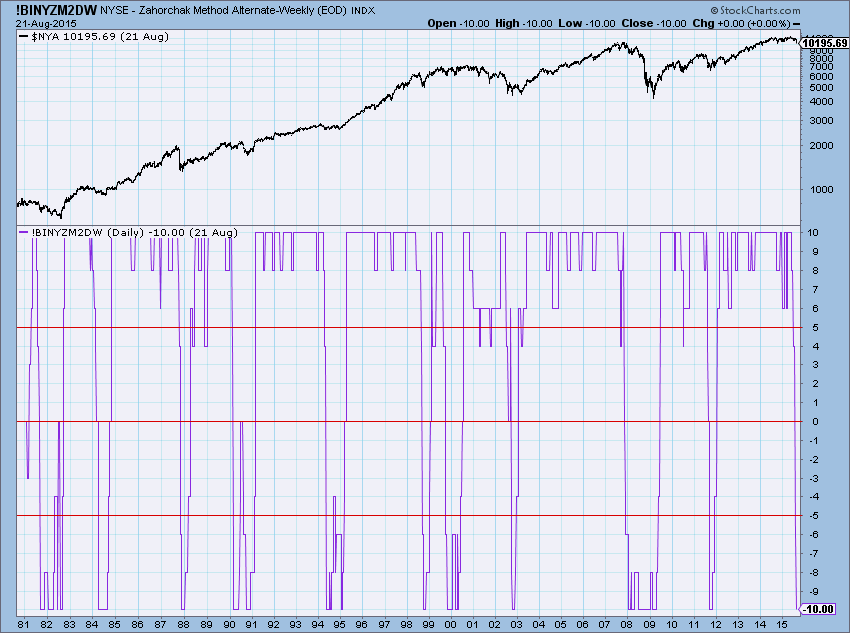
Chart A - Zahorchak Measure Alternate - Weekly
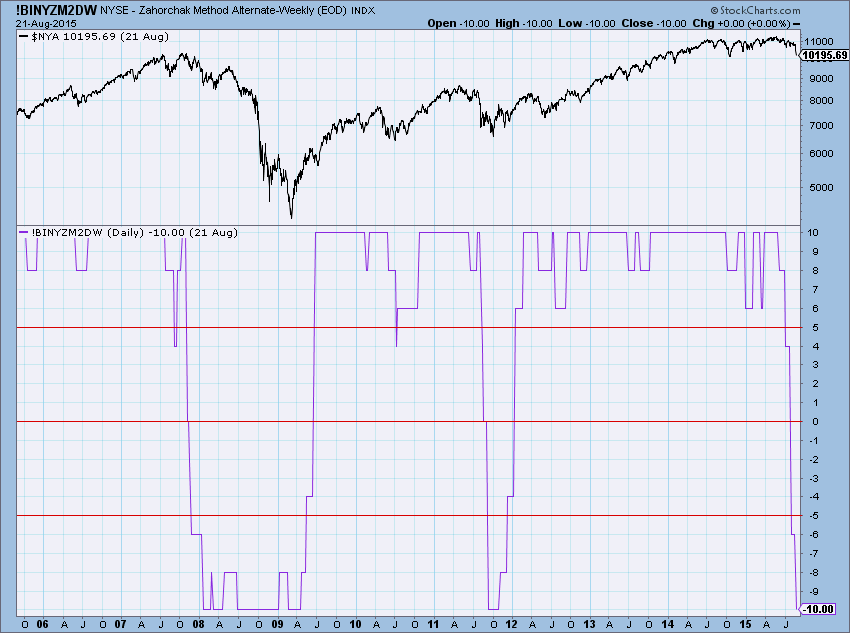
Chart B - Zahorchak Measure Alternate - Weekly
Since I modified the weekly we went ahead and did the same thing for the daily version. Chart C shows the daily alternate ZM for the past 10 years.
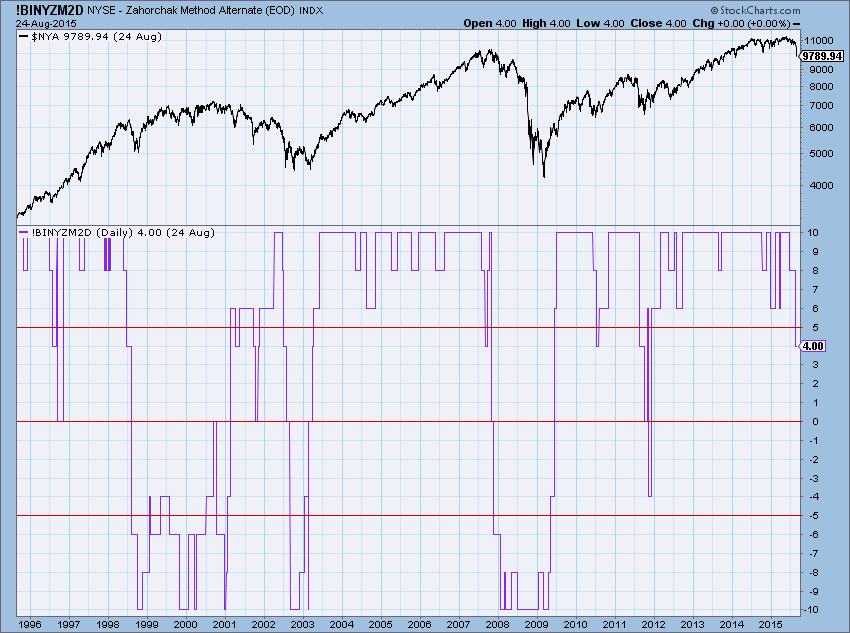
Chart C - Zahorchak Measure Alternate - Daily
StockCharts.com Symbols: !BINYZM2DW (weekly) and !BINYZM2D (daily). The only difference between these “alternate ZM” symbols and the original one is the 2.
I suggest you plot the original and the alternate ZM on the same plot using different colors to see the difference and which one you might prefer.
Trade with process,
Greg Morris


