 I’m quite sure the title had you thinking. Is it about driving a manual transmission automobile aggressively? Or is It a personality trait that is not good? Neither of those are even close, it is about the average (mean) of a strategy’s return distributions.
My Dance with the Trend model measures the trend of the market, then utilizes rules to scale into the trend, and maintains risk containment measures (stop loss) both absolute and relative, and when an uptrend is not identified, a cash position of up to 100% is utilized. There are two distribution concepts at play with this type of model. First the use of stop loss measures will reduce the downside variance and shift the return distribution mean to the right. Secondly, the baggage of trend following, known as whipsaws, will reduce the upside variance and shift the return distribution mean to the left. The benefit is that the mean shift to the right is much greater than the mean shift to the left, yielding a net shift to the right.
Table A shows monthly return for the Dance with the Trend strategy from 1996 to 2012, compared to the S&P 500. You can see that the average (mean) of returns for the Dance with the Trend strategy for this 17-year period was 0.65% versus 0.52% for the S&P 500, and with lower variability as denoted by St. Dev. (standard deviation / sigma). The more significant point is the minimum (Min) value for the strategy is only -5.84% versus the S&P 500 at -16.94%.
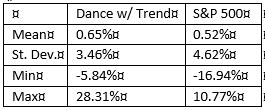
Table A
The top plot in Chart A is the monthly return distribution for the Dance with the Trend strategy from 1996 to 2012. The vertical axis shows the number of events that occurred at the various return levels. The shaded area is the 12 month moving average of those returns so that you can more closely relate to where the bulk of returns occurred. Chart B is the monthly return distribution of the S&P 500 over the exact same time period, also with the 12 month moving average shown. Notice the lack of negative returns (left side) on the top plot of the strategy compared to the S&P 500 in the lower plot. This ability to avoid downside returns provides a right shift (more positive) in the mean of all values. In the top plot there are two return values that have been truncated (two long lines that reach the top of the plot) in order to keep the values in the vertical axis the same as those in the lower plot. There values are 33 and 29. I think it is clear that the Dance with the Trend strategy offers higher returns in addition to much fewer in the negative (left) realm.
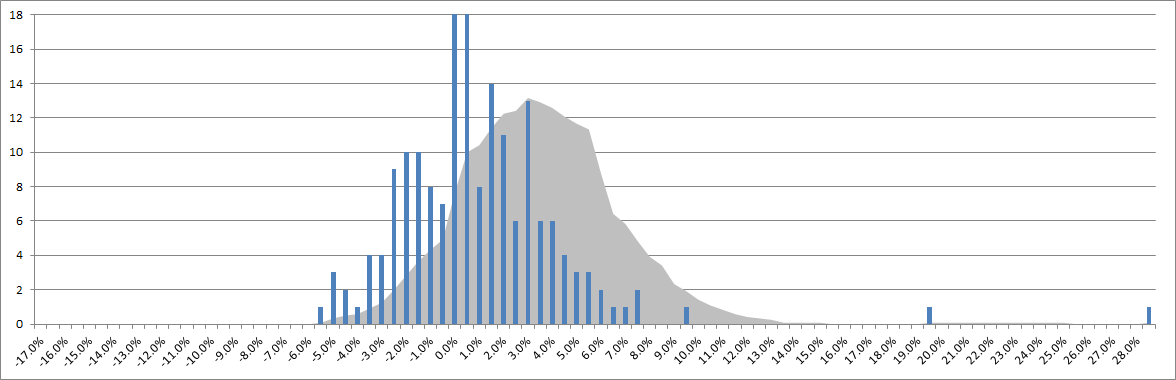
Chart A
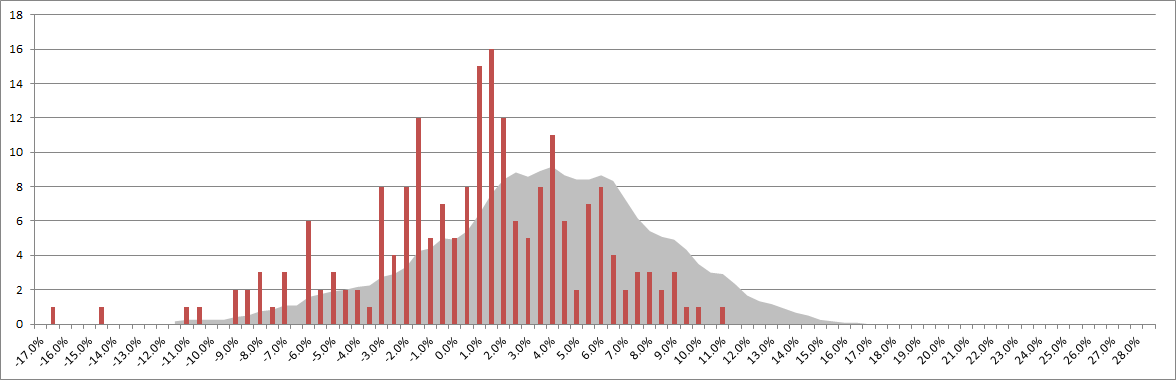
Chart B
That was a lot of performance comparisons. Hopefully, you were able to grasp the message that a rules-based trend following strategy that uses stops and treats cash as an asset class is much better than many, if not most of the investment strategies being hyped by managers who only try to follow a benchmark.
Shifts Mean to Right
Successful trend analysis
Good selection
Stops
Shifts Mean to Left
Whipsaw drag
Inability to follow a model
Stops not followed, if any
I had the pleasure of working with a bright young man when I was at Stadion Money Management, LLC. He used to say he always learned from me; but that wasn’t always the case, he taught me a few things. The following comments about technical model building are from good friend Will McGough, Senior Portfolio Manager at Stadion Money Management, LLC:
- Discipline: can you stick with it through periods of underperformance/whipsaws.
- Implementation: how do you overlay rules or guidelines especially bad if they are to fit certain situations.
- Discretionary overrides: is it 100% mechanical or will you “override” the model (similar to implementation but worth a separate line item).
- Data mining: how were indicator parameters set?
- Hindsight bias: how was the system developed; were indicators ranked or weighted with benefit of all of history or were they updated.
- Short or Leverage: how do you access it? If using ETFs, inverse and leverage reset daily, is that factored in?
- Total Return or Price: be careful when testing on total return or adjusted price history.
- Programming error: back testing 101, don’t trade your signals into the future… is code/formulas accurate? More important if using sophisticated software, how many if/then or for/next loops.
- Trading timing: same day or next day. If same day how do you deal with indicator flips? If next day beware that most open data isn’t correct and if correct isn’t attainable.
- Trading frequency: costs could eat you alive.
- Survivorship bias: if using breadth data make sure historical constituents are correct, some data sources are careless about this.
Trade by Keeping the Mean as far to the Right as Possible,
Greg Morris


