 Before we being the review of Chapter 9 for the 2nd Edition of The Complete Guide to Market Breadth Indicators, I am proud to announce that after over a year of work with many of the fine folks at StockCharts.com, the book is now available in Kindle format from Amazon. Click Here. I priced it to sell – only $19.99. It has lots of new material from Tom McClellan, George Schade, and Dick Arms, plus all of the charts are from StockCharts.com. Plus an entirely new chapter (11) on non-internal breadth indicators. Tom McClellan completely rewrote Chapter 10 on the McClellan Indicators.
And even more good news, we (StockCharts.com and I) have created a ChartPack that has all of the charts in the book, not only for the New York Exchange (in the book), but also for the NASDAQ Exchange and the Toronto Exchange. The ChartPack has 187 charts for the NYSE, 187 for the NASDAQ, and 148 for the TSX Toronto. Toronto is slightly fewer because not all of the breadth data was available, mainly, the weekly breadth data. CGMBI ChartPack – Click Here. This ChartPack means that you have every chart in the book plus the NASDAQ and TSX versions updated each day (each week for weekly data). The ChartPack is only $49.95 and is good as long as you are a subscriber to StockCharts.com. The other really nice feature of publishing with Kindle is that if I want to add something to the book, say I discover a new breadth indicator, I can do so. And everyone who bought the book will receive the update for free. End of sales pitch!
CH 9 Composite Indicators
The breadth indicators in this section utilize different categories of breadth components for their calculation. Some use all breadth components, and some use only two or three components.
Composite Indicators
Arms Index
Arms Open Index
Bretz TRIN-5
Cash Flow Index
Composite Tape Index
Dysart Positive Negative Volume
Eliades New TRIN
Haller Theory
Hindenburg Omen
Market Thrust
McClellan Oscillator with Volume
McClellan Summation Index with Volume
Meyers Systems
Moving Balance Indicator
Technical Index
Titanic Syndrome
Trend Exhaustion Index
Arms’ Index
Also known as: TRIN and MKDS
Author/Creator: Richard W. Arms
Data components required: Advances (A), Declines (D), Up Volume (UV), Down Volume (DV)
Description: The Arms Index (TRIN) is the ratio between advancing issues and declining issues divided by the ratio between the up volume and the down volume. Said differently, it is the ratio of the volume of declining stocks divided by the volume of advancing stocks. A rising line above 1.0 reflects more volume in declining issues and is negative. A falling line below 1.0 reflects more volume in rising stocks and is positive. The Arms index trends in the opposite direction of the market and is considered an inverse indicator.
Special Treat: I asked my good friend Dick Arms if he would write a short piece for this updated book about what his thought process was when creating the Arms Index. The next two paragraphs are from the man himself. Thanks Dick.
The Arms Index was my first invention in a long career of developing technical methods over the years and writing about them in my six books on technical analysis. It was way back in 1967, and I was a young retail broker for the now defunct firm of EF Hutton. We had just moved into a new modern office with the latest in quotation equipment. Those machines on every desk allowed one to see, on a tiny screen, the four factors that make up the index: Advances, Declines, Advancing Volume and Declining Volume. It seemed logical to me to combine these in an equation that would answer the question: “Are the advancing stocks getting their fair share of the volume?” I merely wrote them down as they appeared on my screen and made each a fraction. I started by calculating the first ratio, then the second ratio, and then the comparison of the two ratios.
After a few weeks of playing with the results I showed it to a prominent analyst in the New York office, Newton Zinder. He showed it around to others and before long Barron’s had me write an article about it. From then on it took on a life of its own, and I went on to develop other things such as Equivolume Charting and now Arms Candlevolume charting. The beauty of the Arms Index is that it is so much based upon the core forces of the market place that no matter how closely followed it self-adjusts and cannot, therefore, self-destruct. It was originally called TRIN because the first users were calling it the Trader’s Index. Thanks to the efforts of many other technical analyst supporters it is now generally called the Arms Index.
TRIN came from its original name of Short Term TRading INdex. When computers came along and everyone started attaching their names to their creations (appropriately so), it was changed to Arms Index. The first known writing on it appeared in Barrons in 1967.
Interpretation: Newton Zinder, of E. F. Hutton and Co. has identified the bullishness of the Arms Index when two consecutive days had readings of 2.0 or greater. To produce levels like this there must be a large number of declines compared to advances, plus those declines must garner most of the volume for that day. It represents almost a panic type of selling for the day.
Chart 9-1 is the Arms Index in its basic form. A line is drawn at an Arms Index value of 2.0, showing the extreme levels of large volume going into declining stocks. Remember that this is an inverse (upside down) indicator. You can quickly see that it is volatile and difficult to interpret in this basic form. The following different ways to chart and use the Arms Index will add significantly to its merit.
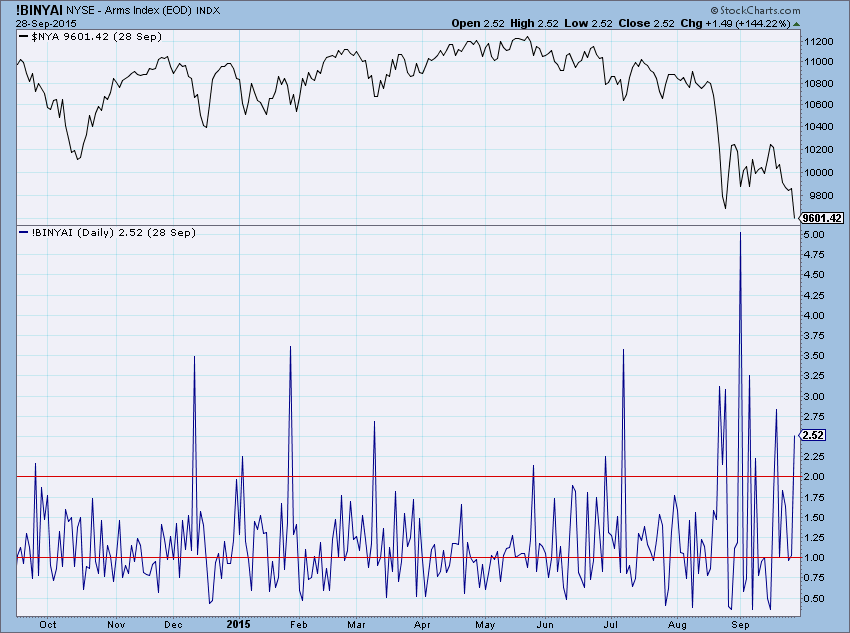
Chart 9-1
Richard Arms has stated that he uses a 21-day smoothing for intermediate forecasts and 55 days for longer term use. In 1991, Richard Arms talked about an oscillator using the 21-day smoothing and the 55-day smoothing of the Arms Index. Whenever the 21-day average dropped below the 55-day average, it was giving a buy signal (remember, this is an inverted indicator), and whenever the 21-day average went above the 55-day average, a sell signal was generated. Richard Arms called this indicator the “Cross Your Arms” indicator. Arms further refined his use of this indicator by suggesting that you use it as an intermediate term market direction indicator, and when it is bullish look for buys only. Likewise, if it is bearish, look only for selling opportunities. A lot like the old saying – don’t fight the tape. A little known fact is that Richard Arms preferred exponential smoothing instead of arithmetic. Thomas Aspray wrote about such an oscillator but used a 10-day average and a 30-day average for his indicator. The “cross your arms” indicator is shown in chart 9-2.
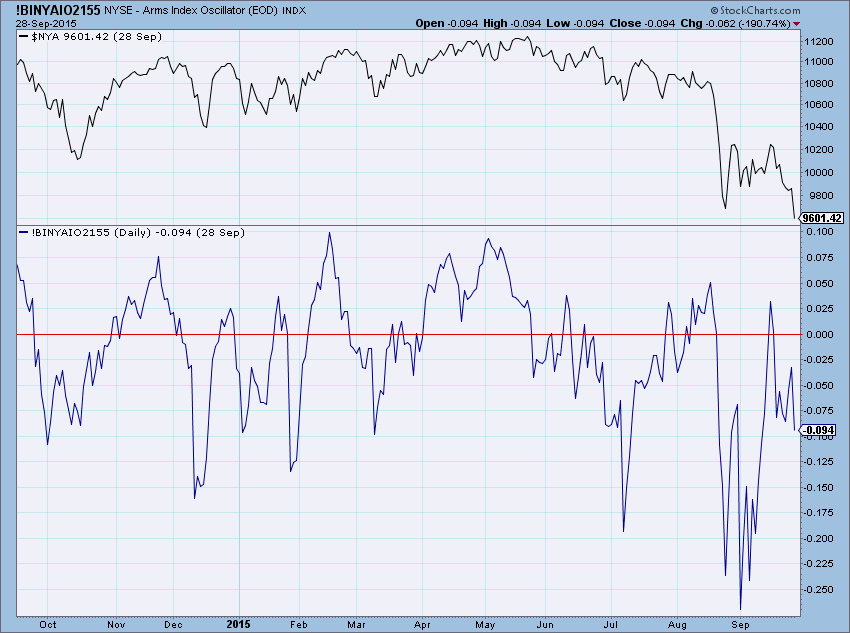 Chart 9-2
Hindenburg Omen
Also known as: New High New Low Sell Signal
Author/Creator: James R. Miekka.
Data components required: New Highs (H), New Lows (L), Advances (A), Declines (D), Total Issues (TI), Market Index (MKT).
Description: This indication of market tops was created by James R. Miekka and dubbed “the Hindenburg Omen” by Kennedy Gammage of the Richland Report. You’ll recognize Kennedy as the former provider of the McClellan Oscillator and Summation Index numbers on FNN and now, CNBC television.
The remaining material on this indicator was written by the late James R. Miekka, creator of the Hindenburg Omen:
The Hindenburg Omen is a sell signal that occurs when NYSE new highs and new lows each exceed 2.8% of advances plus declines on the same day. In addition, the NYSE index must be above the value it had 50 trading days (ten weeks) ago. Once the signal has occurred, it is valid for 30 trading days. Any additional signals given during the 30-day period should be ignored. During the 30 days, the signal is activated whenever the McClellan Oscillator (MCO) is negative, but deactivated whenever the MCO is positive. The signal starting point was originally calculated to be when NH and NL equaled or exceeded 2.4% of total issues traded, but was later simplified to 2.8% of advances plus declines. This signal was developed as an improvement upon the Split Market Sell Signal developed by Gerald Appel. Appel’s signal used a fixed number of new highs and new lows (45 of each), which was not indexed for increasing numbers of shares trades, and his signal did not require validation by the MCO being negative.
Interpretation: This signal generally occurs after a rising market when the number of new lows is rising rapidly, but when new highs are still quite numerous. The large number of highs and lows suggests that the market is indecisive and probably at a turning point. Of course, a similar scenario can occur during a falling market when new lows are numerous but new highs begin to rise rapidly. The latter condition would suggest that such market indecision could be a buy signal in a falling market. This has not been studied, at least not by James Miekka, other than to note that the sell signal is not reliable when NYSE is below its ten-weeks-ago value. To utilize the Hindenburg Omen signal, Miekka suggests the following:
1. Go short the market whenever the McClellan Oscillator is negative during the 30 trading days after a valid signal has been given.
2. Exit the market for 30 days whenever the signal is given, or at least be wary of any new stock or stock index purchases while the signal is valid and especially if it is activated by a negative MCO.
By exiting the market when a signal was given on September 23, 1987, you would have avoided the crash of 1987.
Author Comments: Jim Miekka has provided a significant indicator of market danger. An indicator developed from a logical point of view is usually one that will serve you well. This one does just that. In chart 9-20 I have tried to recreate this indicator as closely to Miekka’s parameters as I can. Any difference between the chart signals and Jim’s actual are a fault with my programming.
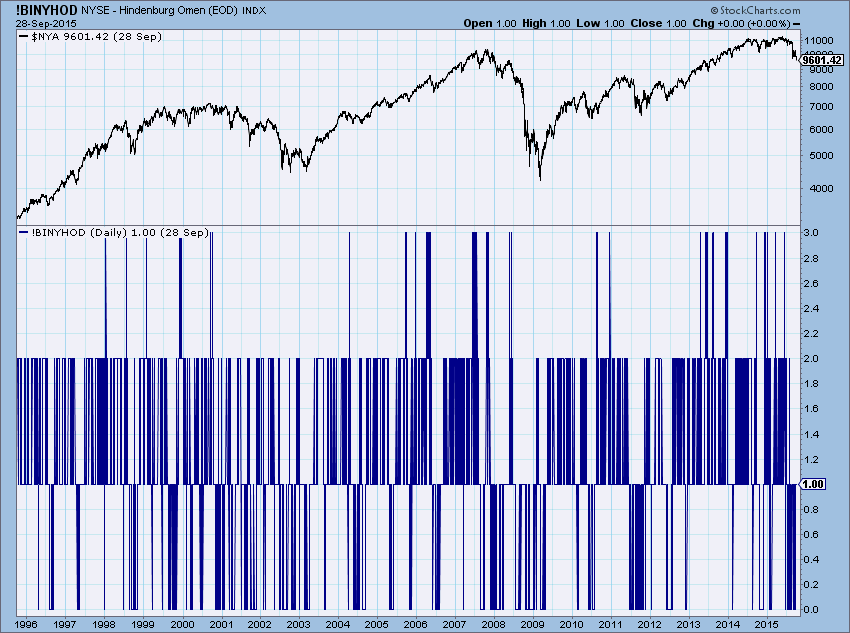 Chart 9-20
While it is not the purpose of this book to discern performance of these breadth indicators, Jim provided this for me and I want to deviate from that purpose just this once. The table below gives a history of the Hindenburg Omen from 1993 to 2004, using the old NYSE as the index. To convert to new NYSE, multiply the points by 10.78.
Table 9-1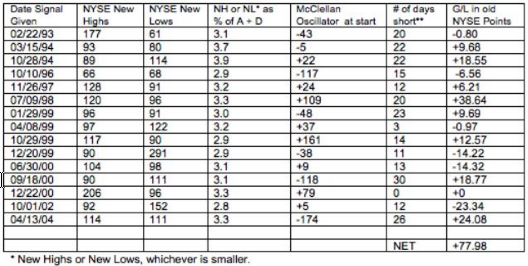
** Short only when the McClellan Oscillator is negative for 30 days after signal is given.
StockCharts.com’s Symbol: !BINYHOD
References:
Gammage, Kennedy, 2004,The Richland Report, LaJolla, CA.
Miekka, James R., The Sudbury Bull and Bear Report, St. Petersburg, FL.
McClellan Summation Index with Volume
Author/Creator: Greg Morris
Data components required: Advances (A), Declines (D), Up Volume (UV), Down Volume (DV).
Description: This is the McClellan Summation Index with a volume component added to the calculation. Instead of using just advances (A), I have used advances times up volume (A * UV). The formula is identical to the original McClellan Summation Index other than the added volume component.
Interpretation: This summation index should be interpreted just the same as the other two versions, including the original, and is shown in chart 9-27.
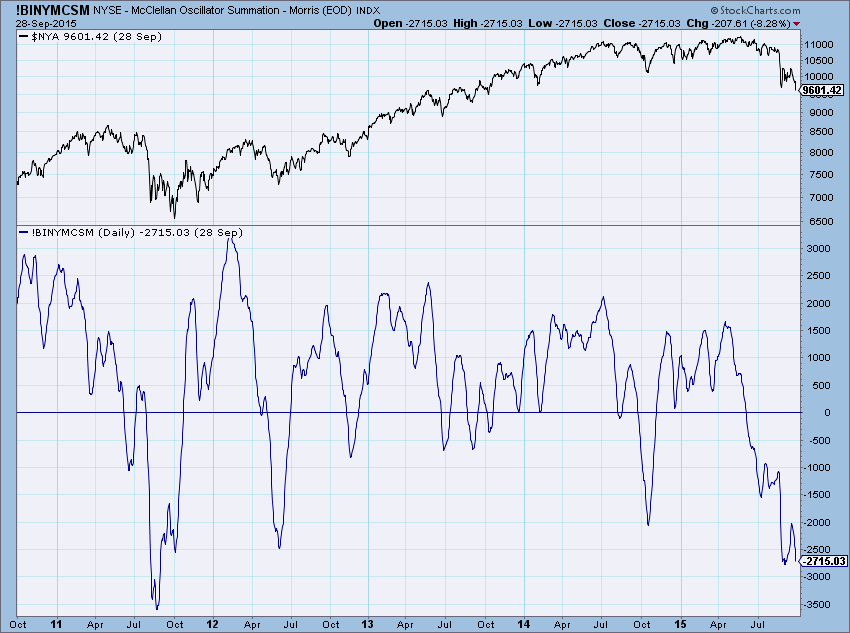 Chart 9-27
Author Comments: I have always preferred the influence of volume on price-based indicators. Like the original McClellan Summation Index, the direction and the level of this indicator are important.
Formula: This is the accumulation of the McClellan Oscillator that uses both advances and declines, and up volume and down volume.
StockCharts.com’s Symbol: !BINYMCSM
References:
McClellan, Sherman and Marian. Patterns for Profit. Lakewood, WA : McClellan Financial Publications, Inc., 1976. This book was originally published by Trade Levels in 1970.
McClellan Family Interview, “It’s All In the Family: Sherman, Marian, and Tom McClellan.” Stocks and Commodities, Volume 12, June 1994, pp. 264-273.
There is only one more article for this series that covers Chapter 11 on non-internal breadth indicators. These are indicators like the % above a moving average, participation, etc.
The Complete Guide to Market Breadth Indicators 2nd Edition and CGMBI ChartPack.
Trade well,
Greg Morris


