 CH 8 Up Volume Down Volume Indicators
As a reminder these articles about the chapters in the upcoming book are only samples of what are in each chapter; they are not the entire chapter.
The breadth indicators in this section utilize either up volume, down volume, or both in their calculation. Please do not confuse this with the plethora of technical indicators that use total volume.
Up Volume and Down Volume Indicators
Up Volume
Down Volume
Changed Volume
Up & Down Volume
McClellan Oscillator – Volume
McClellan Summation Index – Volume
Merriman Volume Model
Swenlin IT Volume Momentum Oscillator
Swenlin Trading Oscillator – Volume
Up Volume Down Volume Line
Cumulative Volume Ratio
Up Down On Balance Volume (OBV)
Volume Percentage Ratio
Upside – Downside Volume
Upside / Downside Volume Ratio
Zweig Up Volume Indicator
Up & Down Volume
Data components required: Up Volume (UV), Down Volume (DV).
Description: A chart showing the up volume and down volume on the same plot will tell a lot about where volume is flowing. Smoothing each of them will make it much easier to use and interpret.
Interpretation: In chart 8-7, the up volume is the solid line and the down volume is the dotted line. You can see how the up volume generally increases during up moves and the down volume increases during down moves. This is normal market action and is to be expected. It is the deviation from this that you need to watch for.
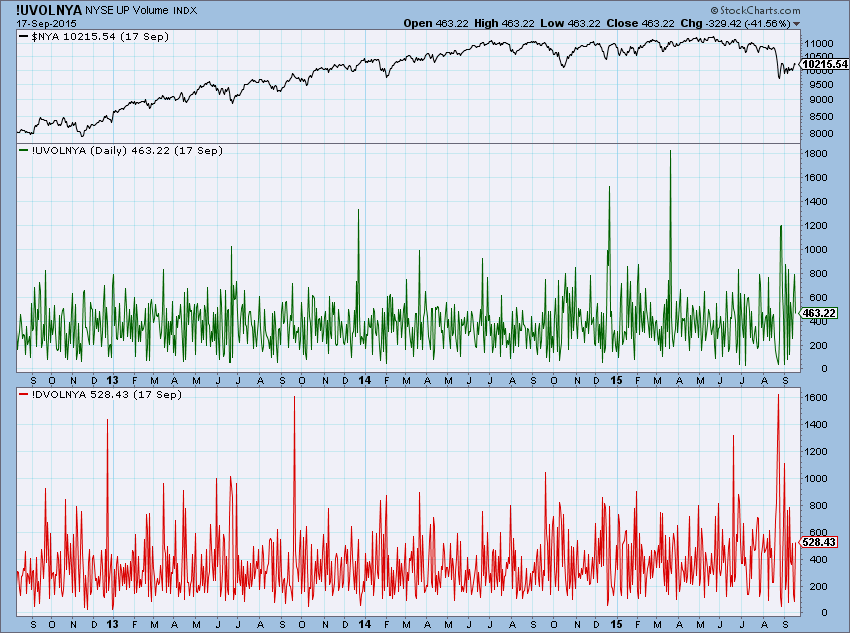
Chart 8-7
Author Comments: You can see that as a market drops in price, the down volume steadily increases and peaks right at the market bottom. Just after the market bottom, up volume rises quickly and continues to dominate throughout the upward move. You can also see that even small corrections in the market will cause the up and down volume to react significantly. Trends in the market are shown when one of the lines remains above or below the other for extended periods of time.
Formula: (UV), ( DV)
McClellan Oscillator – Volume
Author/Creator: Sherman and Marian McClellan
Data components required: Up Volume (UV), Down Volume (DV).
Description: This is the McClellan Oscillator but instead of using advances and declines data, up volume and down volume data are used. The calculation is exactly the same, only the data components are changed.
Interpretation: Using the analogy that volume precedes price, the McClellan Oscillator using up and down volume should be used in the same manner as the advance decline based McClellan oscillator. Look for extreme readings to warn against market turning points. Keep this in mind: the market cannot go up in a healthy way without good accompanying up volume. It can certainly fall much easier. Trendline analysis of the McClellan Oscillator - Volume is also a good technique when using this indicator. Chart 8-8 shows the McClellan Oscillator - Volume.
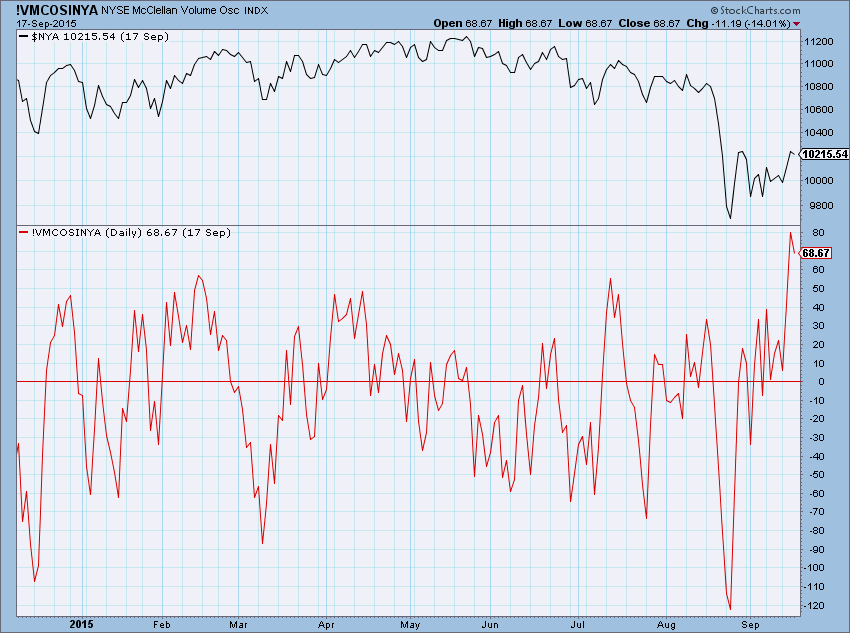
Chart 8-8
Author Comments: From chart 8-8, it appears that watching this indicator as it crosses from below to above the zero line will almost nail the market bottoms, including those that are just trading rallies. This is probably because changes in the market are more quickly reflected in the up and down volume.
The McClellan Volume Oscillator also has importance when one compares it to the McClellan Advance Decline Oscillator. When the two disagree, such as if one moves above the zero line while the other does not, it is usually the Volume Oscillator that tells the truer story. Volume is not always the correct one, but that is the tendency and any disagreement is a sign for the analyst to be concerned.
Volume also differs from Advance Decline numbers in that Volume numbers are theoretically limitless, whereas the difference between Advances and Declines can never be greater than the number of issues traded. Big volume trading days can therefore have a bigger impact on volume breadth indicators like the McClellan Volume Oscillator. Conversely, small volume days like the day after Thanksgiving can have only a minimal contribution to changing the volume-based oscillator, while the Advance Decline Oscillator does not know the difference. My thanks go to Tom McClellan who reviewed this section and the following one on the McClellan Summation Index – Volume.
Formula: (Today’s 19 exp average of (UV – DV) – (Today’s 39 exp average of (UV – DV)
StockCharts.com Symbol: !VMCOSINYA
References:
McClellan, Sherman and Marian. Patterns for Profit. Lakewood, WA : McClellan Financial Publications, Inc., 1976. This book was originally published by Trade Levels in 1970.
McClellan Family Interview, “It’s All In the Family: Sherman, Marian, and Tom McClellan.” Stocks and Commodities, Volume 12, June 1994, pp. 264-273.
McClellan Summation Index - Volume
Author/Creator: Sherman and Marian McClellan
Data components required: Up Volume (UV), Down Volume (DV).
Description: Like the McClellan Oscillator that uses volume, this is the McClellan Summation Index using up volume and down volume instead of the advances and declines. The calculations are identical, just the breadth components have changed.
Interpretation: As with the McClellan Advance Decline Summation Index, the Volume Summation Index indicates the prevailing trend for the market based its direction of movement. It also makes for a nice intermediate term overbought/oversold indicator when it reaches extreme values. The McClellan Volume Summation Index is shown in chart 8-9.
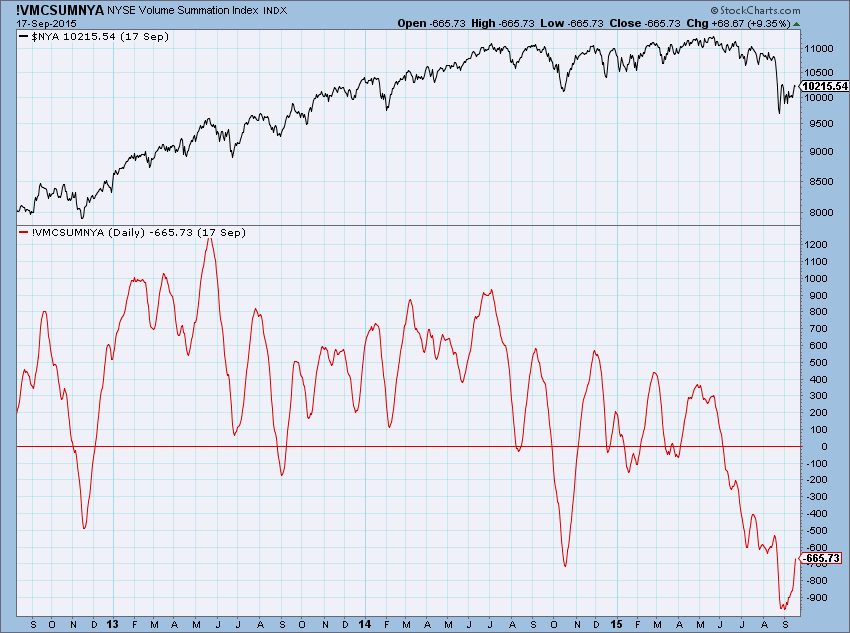
Chart 8-9
Author Comments: Because of the large increases in daily trading volume over the years, making a ratio adjustment of the daily Up and Down Volume figures is even more important than for the A-D numbers when trying to make long-term historical comparisons. The McClellans do this adjustment in the same way for Volume that they do for Advance Decline, by dividing the Up Down Volume difference by the total of Up plus Down Volume. The one drawback is that this equalizes all trading days, so big or small volume days do not have the same impact that they would in the raw calculations.
Formula: This is the accumulation of the volume based McClellan Oscillator.
VOLSUMTODAY = VOLSUMYESTERDAY + VOLOSCTODAY
StockCharts.com Symbol: !VMCSUMNYA
References:
McClellan, Sherman and Marian. Patterns for Profit. Lakewood, WA : McClellan Financial Publications, Inc., 1976. This book was originally published by Trade Levels in 1970.
McClellan Family Interview, “It’s All In the Family: Sherman, Marian, and Tom McClellan.” Stocks and Commodities, Volume 12, June 1994, pp. 264-273.
Swenlin IT Volume Momentum Oscillator
Also known as: ITVM
Author/Creator: Carl Swenlin
Data components required: Up Volume (UV), Down Volume (DV), Total Volume (V).
Description: The Intermediate Term Volume Momentum Oscillator is a barometer of breadth. To calculate the ITVM add the daily McClellan Oscillator - Volume (ratio adjusted using the difference of up and down volume divided by the total volume) to the daily 39 day exponential average, then calculate a 20 day exponential average of the result.
Interpretation: Carl Swenlin offers the following comments: It is better if this indicator is above zero line and rising. Below the zero line and falling is the worst scenario. Rising is better than falling, even if below the zero line. Just like the McClellan’s version with volume, this is Carl’s volume version of his Intermediate Term Breadth Momentum Oscillator. Chart 8-11 shows the ITVM.
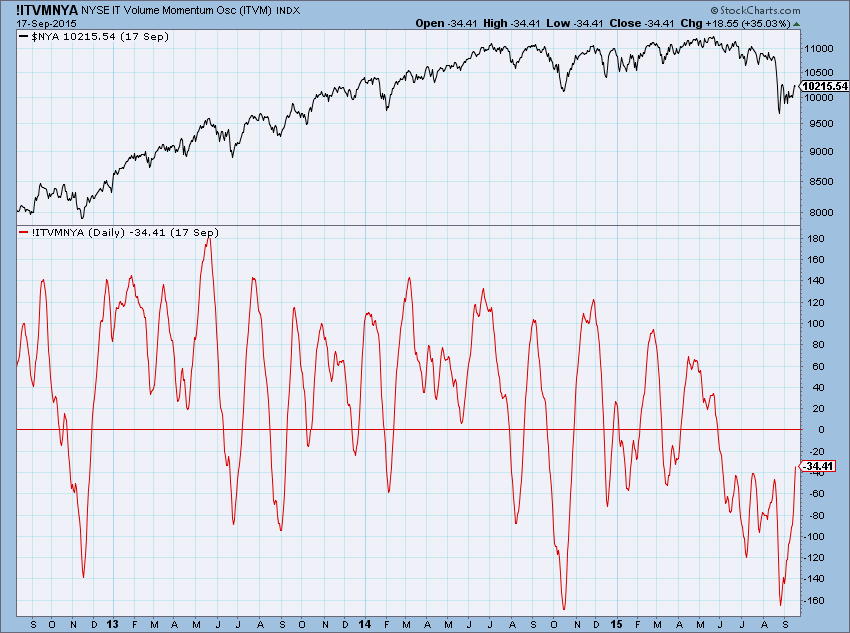
Chart 8-11
Author Comments: The indicator troughs seem to pinpoint market bottoms and the peaks point out the loss of upside momentum.
StockCharts.com Symbol: !ITVMNYA
References:
Swenlin, Carl, www.decisionpoint.com, now StockCharts.com..
Cumulative Volume Ratio
Author/Creator: John C. Lawlor
Data components required: Up Volume (UV), Down Volume (DV).
Description: This is an indicator that sums the up volume for the last 50 days and divides it by the sum of the down volume over the last 50 days.
Interpretation: This will indicate the momentum of volume over a predetermined time period. For example, if the number of days used is 50, and the ratio is equal to 4, it means there was an average of 4 times as much up volume as there was down volume over the last 50 days. Likewise, if the value of the ratio (up volume/down volume) over 50 days, is -3, it means that 3 times more down volume than up volume occurred during that time frame. One can also see from chart 8-14 that divergence with price seems to be an early indicator of market direction.

Chart 8-14
Author Comments: Lawlor developed a methodology in which he identified cyclicality in the Cumulative Volume Ratio. This seemed to be more prevalent when using the ratio over a 10 day period. While not precise in identifying significant tops and bottoms, it did seem to show short term price peaks with some consistency. Chart 8-15 is shown with a 10 period ratio and its 10 period cyclicality (dotted sine wave).
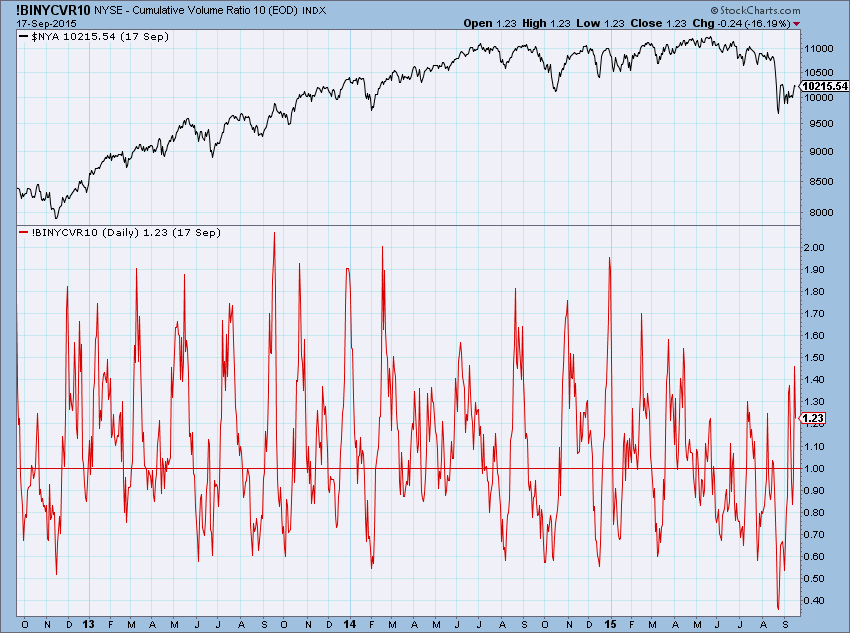
Chart 8-15
Formula: Previous Value + (UV for 50 days / DV for 50 days)
StockCharts.com Symbol: !BINYCVR50, !BINYCVR10
References:
Lawlor, John, “Cumulative Volume and Momentum.” Stocks & Commodities, February 1988, pp. 67-69.
Zweig Up Volume Indicator
Show Zweig Double 9 Down Volume Ratio and Zweig Double 9 Up volume ratio.
Author/Creator: Martin Zweig
Data components required: Up Volume (UV), Down Volume (DV).
Description: This is another of Dr. Martin Zweig’s momentum indicators. This one uses a ratio of up volume and down volume. This ratio shows the powerful thrust of the market and cannot be ignored.
Interpretation: Whenever the ratio reaches 9 to 1, a good buying opportunity exists. There have been 53 signals given since 1965. The biggest ratio ever was on August 17, 1982, the beginning of an 18 year bull market. The chart below shows each occurrence of the 9 to 1 up volume ratio since 1965, identified by the down spikes that go down to -9. You will notice in chart 8-24 that they generally happen near significant, certainly tradable, market bottoms.
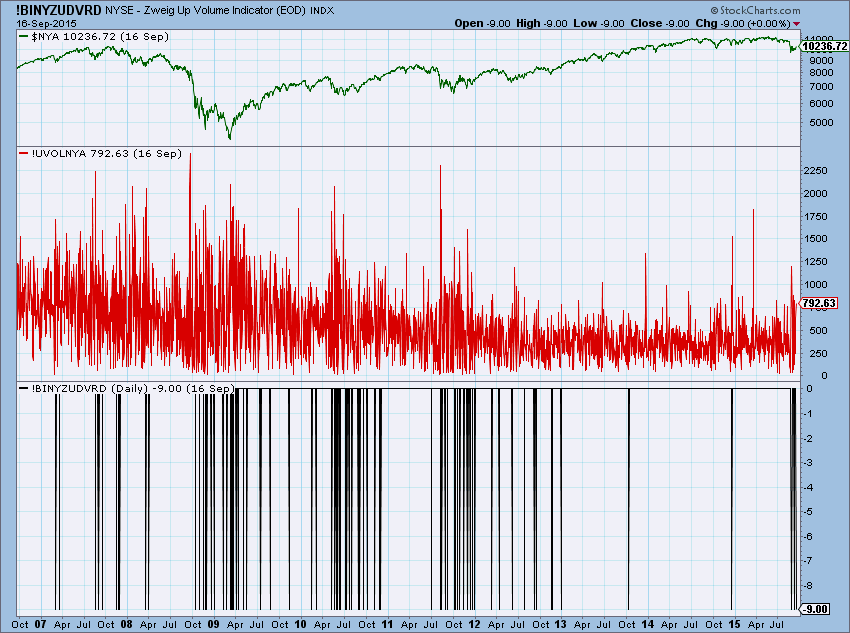
Chart 8-24
A further concept from Dr. Zweig is to expand the 9 to 1 ratio of up volume to down volume to state that anytime there are two signals in any 3 month period, the evidence suggests a strong market to follow. Since 1965 there have been 21 of these “double nine” signals.
Here is a video interview I did last month. Click Here.
Trade well,
Greg Morris
