 I have mentioned many times I that I basically only work with daily market data. I do not have the personality to deal with intraday data and weekly data is only good for long term use. I do have a few weekly data indicators that I use as overlays to my trend model, but the bulk of then are daily. One of the concepts I think you must deal with when using daily data is to come up with a method that removes the noise. Noise in this instance is very short term fluctuations in price. One of the most popular is the moving average; and it comes in many flavors. There is a significant difference between the simple and exponential moving average.
I’m not going to mention the details of these but highlight a difference that just might not have been obvious and is certainly nice to know if you sometimes cannot decide which you prefer. Hopefully, with this knowledge, that issue will be solved. Look at Chart A, which shows a price chart and a 50-day simple (arithmetic) moving average (red) and a 50-day exponential moving average (blue). No surprises here! We all know the exponential average will hug the data closer and reverse sooner than the simple average. Now here is the information I want to share. Because of the math of calculating the exponential average it will ALWAYS reverse direction immediately after crossing the price data (blue arrow). Always – every time, no exceptions! Of course, the simple average will most times continue and eventually roll over in the direction of price at a later date. This is all dependent upon the magnitude of the movement of the price data and the number of periods used in the average. In the example in Chart A, the simple average did not reverse its upward movement until almost 2 weeks later at the red arrow.
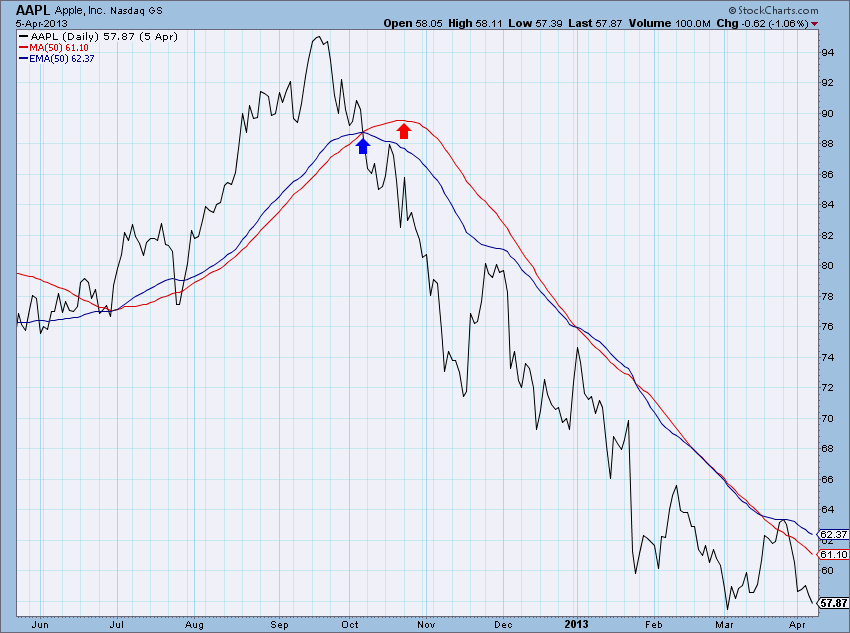 Chart A
I think you will agree that there is a time to use simple averages and a time to use exponential averages and hopefully that time is used consistently and not fitted to display the message you are trying to convey, or worse yet, hope for. Since all of this is an art, I’ll just share how I do it and some reasons why. The underlying purpose of smoothing a data series is to remove some of the noise. My favorite description comes from my 5th printing edition of J.M. Hurst’s 1970 tome, “The Profit Magic of Stock Transaction Timing.” Incidentally, the price of the book was $5.95 when I bought it in the late 1970s.
-
A moving average of any given time span exactly reduces the magnitude of the fluctuations of duration equal to that time span to zero.
-
The same moving average also greatly reduces (but does not eliminate) the magnitude of all fluctuations of duration less than the time span of the moving average.
-
All fluctuations greater than the time span of the average “come through,” or are present in the resulting moving average line. Those with durations just a little greater than the span of the average are greatly reduced in magnitude, but the effect lessens as periodicity duration increases. Very long duration periodicities come through nearly unscathed.
Personally, I use simple averages whenever using periods (days) less than 65, and exponential for periods of 65 or greater. Why? Using exponential smoothing on short term data does not effectively reduce the noise which is what I’m trying to accomplish. Similarly, using simple averages on longer term data, does not respond in a timely enough manner. I realize this concept it totally debatable but do strongly believe one should use them consistently, whatever they are. Share your preferences with the others in the comment section.
There are many other techniques that can be used to filter the noise, but I’ll stick with the moving average this time. Other techniques will be covered in a future article.
Dance with the Trend,
Greg Morris


