 Early in writing these articles I talked a lot about market internals or market breadth. As a refresher, I’ll review the basics and then offer an opinion on why breadth is so important.
Breadth Components
Breadth components are readily available from newspapers, online sources, etc. and consist of daily and weekly statistics. They are: Advances, Declines, Unchanged, Total Issues, Up Volume, Down Volume, Total Volume (V), New Highs, and New Lows. From one day to the next, any issue can advance in price, decline in price, or remain unchanged. Also any issue can make a new high or a new low. Here are more specific definitions:
Advancing Issues or Advances (A) – Stocks that have increased in price from one day to the next, even if only by one cent, are considered as advancing issues or advances. A bullish market will take many, if not most, issues with it. As the market rises, the number of advances will remain fairly high with the usual oscillations as traders move in and out of the market. Most often the advancing issues will start to decline in number well before the price action reflects a market starting to peak. This is because fewer and fewer issues are continuing to rise. The prices continue to rise because most market averages are capitalization weighted and the generals continue to lead the charge.
Declining Issues or Declines (D) – Stocks that have decreased in price from one day to the next are considered declining issues or declines. It is when the declines begin to rise that the topping formation is reaching its final stages.
Unchanged Issues or Unchanged (U) – Stocks that do not change in price from one day to the next are considered unchanged issues or unchanged.
Total Issues (TI) – This is the total of all issues available for trading on a particular exchange. If you added the advances, declines, and unchanged issues together it would equal the total issues.
Advancing Volume or Up Volume (UV) – This is the volume traded on a day for each of the stocks that are advancing issues. It is the total volume of all the advances.
Declining Volume or Down Volume (DV) – This is the total volume for all the declines for a particular day.
Stocks can still advance and the amount of volume will be the first indication of a weakening advance. As an up move begins to falter, the up volume will be one of the first hints that all is not well. It is generally not the case that the declining volume will lead the declining issues when the market is in a maturing top formation. Markets can drop merely from a lack of up volume; they do not need a large increase in down volume. As a market declines, the down volume will come back into play and can be used to help identify the beginning of a bottom. The down volume will quickly dry up and the up volume will rise quickly at a market bottom.
Total Volume (V) – This is the total volume of all trading for a particular day. Total volume is the sum of Up Volume, Down Volume, and Unchanged Volume. To find Unchanged Volume subtract the sum of Up Volume and Down Volume from the Total Volume. Total volume is not generally considered a breadth component, but is many times used in a ratio with the up or down volume to alleviate the increase in trading activity over long periods of time.
New High (H) – Whenever a stock’s price reaches a new high price for the last 52 weeks it is termed a new high.
New Low (L) – Whenever a stock’s price reaches a new low price for the last 52 weeks it is termed a new low.
The new highs and the new lows are not related like the advances and declines. An advance or decline is based upon a single day’s price change. A new high or new low is based upon the previous year’s price changes. It is critically important to remember this as it is the one thing I see misunderstood the most. Daily changes in price are drastically different than yearly changes.
The True Benefit of Following Breadth
Chart A shows the S&P 500 in the top plot and one of my breadth indicators in the bottom plot. As a market enters the distribution phase (the topping process), it is not uncommon for many investors to begin to move their money from riskier (small cap) stocks into what is perceived to be safer stocks such as large cap and blue chip. Most market indices are capitalization weighted, which means the larger stocks in the index tend to make the index move more than the smaller stocks. When investors are seeking safety, this causes the cap weighted indices to move higher. Breadth, which treats each stock equally will show a decline like you see in Chart A. This is a very common signature of breadth and almost always happens at major market tops. The problem is that, like many market indicators, it also happens at lessor turning points in the market. You can, however, count on it to at the very least to be an early warning signal of a topping process.
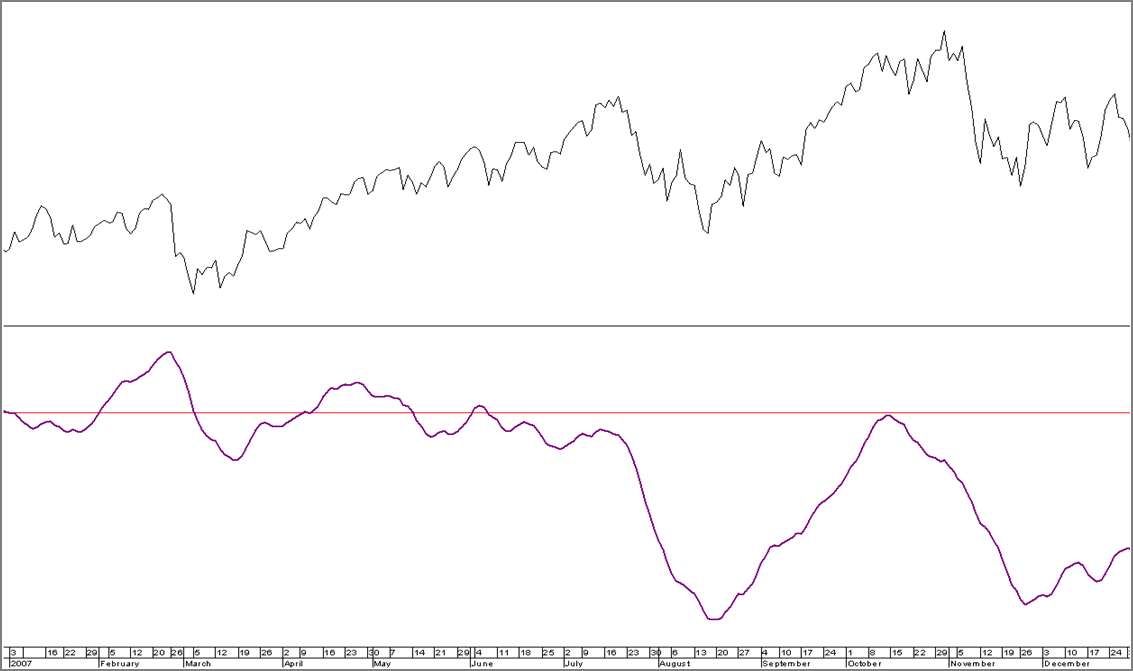 Chart A
Think of breadth as an early warning sign for market tops; not always correct, but rarely misses one.
Dance with the Trend,
Greg Morris


