 One of my trend following indicators was created because I felt that there were some issues with market breadth that needed attention. For example, the Friday after Thanksgiving. The market is only open a few hours and trading volume is very light. There are price changes but nothing exceptional. However, there is always a full complement of breadth data no matter how long the market is open. It was my feeling that it would be nice to be able to ignore breadth data when daily volume is down, and/or the market wasn’t open for a full day. Hence, a breadth indicator was created that I called Combo, short for combination. Wow, my indicator naming ability is exceptional, isn’t it?
The concept is quite simple. I use advances, declines, up volume, and down volume (Nasdaq, of course). For total volume I just add the up volume and down volume, which ignores the unchanged volume. If it is unchanged it has little affect on the indicator, so is not used. I then take an 18-day arithmetic average of the up volume, and the same for the down volume. If the Up volume on any day is greater than its 18-day moving average, it is part of the formulae; if it isn’t greater, it is ignored. Same for the down volume; if greater than 18-day moving average it is used; if not, it isn’t. I then take a ratio of the useable up volume minus the useable down volume divided by the total volume. (Up Volume – Down Volume) / Total Volume. This ratio is then put into an MACD-like formula using 19 and 39 days. See Building a Rules-Based Trend Following Model - 8 for similar formula and more explanation.
Chart A shows the Combo indicator in the bottom plot along with the Nasdaq Composite Index in the top plot. The time period is from January 2008 to June 2009, which covers the last bear market. Whenever the Combo is below the zero line it is off and when above the zero line it is on. Just a binary signal based on crossing the zero line.
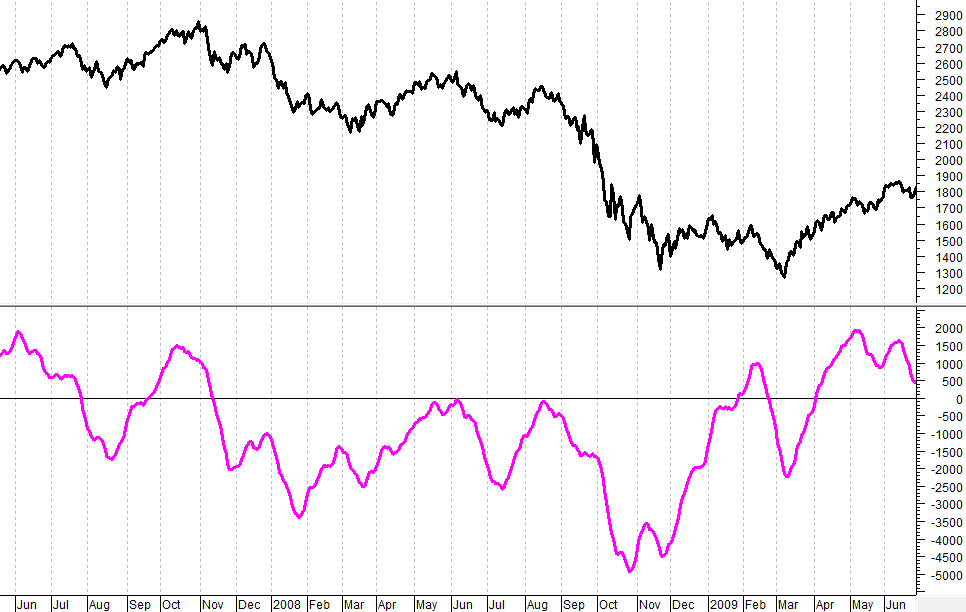 Chart A
Chart B shows the Combo indicator for the past 18 months. Always keep in mind that each of my indicators must perform by themselves but are never used that way. They are a component of the weight of the evidence.
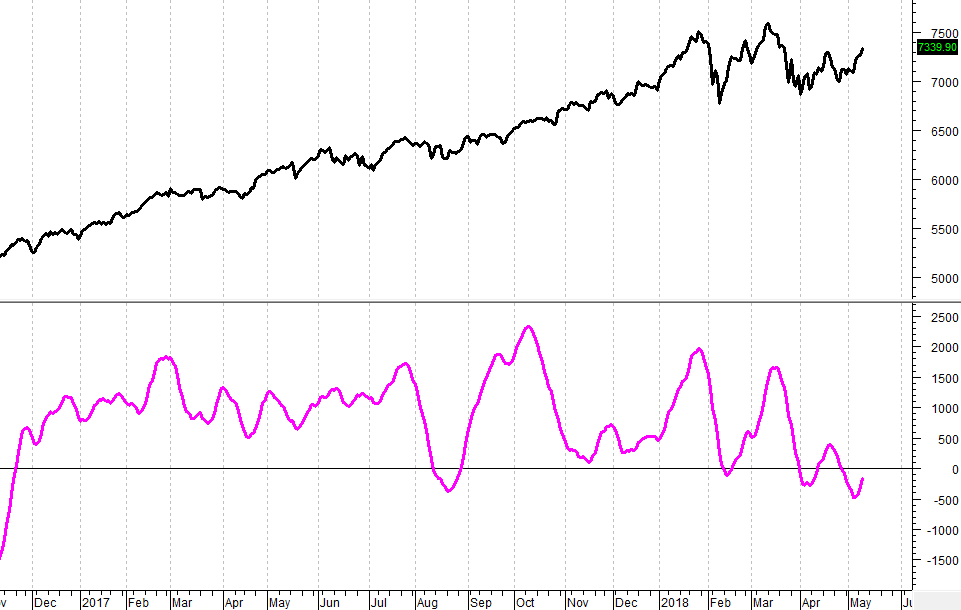 Chart B
Table shows the performance characteristics of the Combo indicator for over 30 years. For a review of the information in this table, please see Building a Rules-Based Trend Following Model – 7. The first column shows the various parameters being tested. The 18/0 parameter is the one used in the charts above. The 18 is for the smoothing value used to qualify the up and down volume being used and the 0 is for the signal crossing line value.
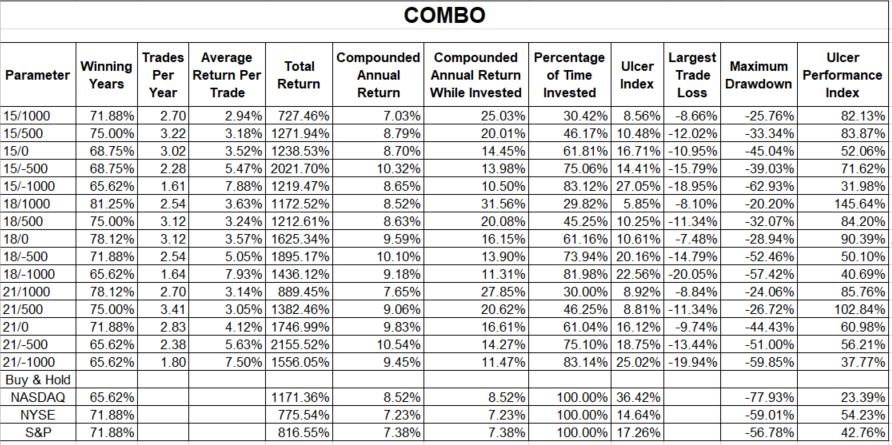 Table A
I know it is probably frustrating that these indicators are not part of StockCharts.com’s symbol library, but the purpose of this series of articles is to give you ideas and concepts on how to build this type of model. It is not to hand you the model in a ready-to-use right out of the box format. If I did that, you wouldn’t follow it because you didn't devote any time to its creation. This way, if you are serious about building a rules based trend following model, you have been given the concepts to do so. I hope you understand. I am going to get away from individual indicators for a while in this series; plan on focusing on ranking and selection process.
Dance with the Trend,
Greg Morris


