 Too often I see a basic misunderstanding between Momentum, Rate of Change, and Price Difference. Let me try to make it clear. They are essentially the same thing.
Momentum
Momentum deals with the rate at which prices are changing, kind of like acceleration and deceleration. Here is the formula for momentum: (Close / Close n periods ago) x 100 (n denotes the number of periods used). If there is no change in price over your specified time period, Momentum will be 100; positive price changes will have Momentum greater than 100 and negative price changes will have Momentum less than 100. Price changes refer to the current price change relative to the price n periods ago.
Rate of Change (ROC)
Rate of Change measures the amount of the movement about unchanged (above and below 100, where 100 is unchanged) in this formula: ((Close – C n periods ago)/C n periods ago)) x 100 (n denotes the number of periods used). Rate of Change is the same measure as Momentum but puts the value in percentage terms, for example a Rate of Change of 5% would be Momentum of 105, because 105 is 5% greater than 100.
Price Difference
And of course, Price Difference is simply: Close – Close n periods ago. This simplicity is not my preferred because it depends on the price of the issue being analyzed. Which means the scale will not be easily compared to other issues. And certainly meaningless.
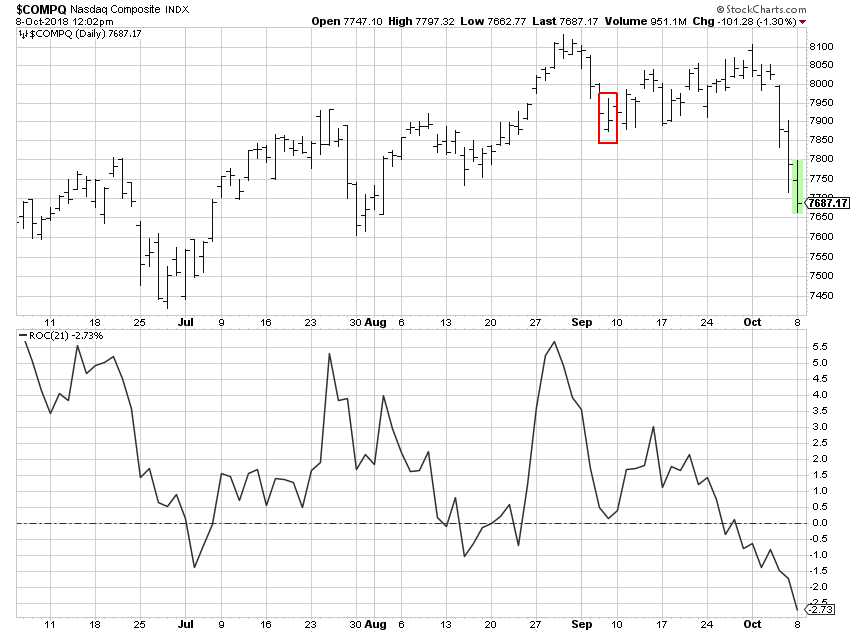
StockCharts.com only offers Rate of Change (ROC) and you soon will know why this is enough. In Chart A, I used a value for n of 21 days (periods). Let’s do the math on this example.
The last close on 8 Oct was 7687.17 as shown on the green (real time) bar. The close on 7 Sep (21 days ago) (red box) was 7902.54.
7687.17 – 7902.54 = -215.37
215.37 / 7902.54 = -0.0272532
-0.02725 x 100 = -2.73 which is shown on the bottom right of the chart. Note: 2.725 rounds to 2.73.
This means the latest close is 2.73% below the close 21 days ago.
 Chart A
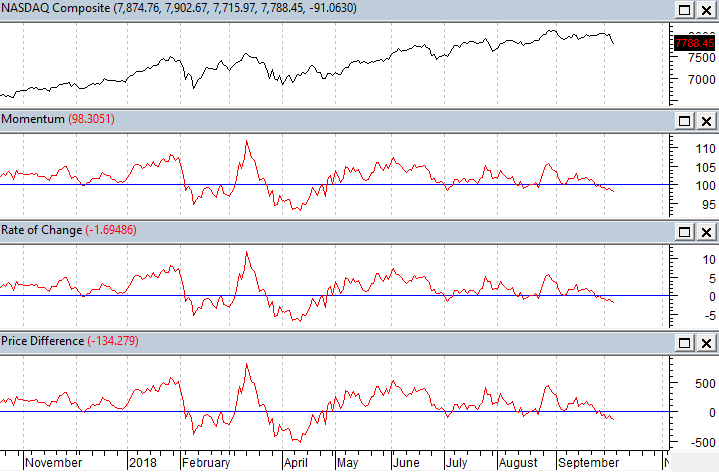
The fact that StockCharts.com only offers ROC should not be of concern. Chart B shows all three indicators, Momentum, Rate of Change, and Price Difference using 21 days as the parameter. The scale on the right side for Momentum oscillates around 100, the scale for ROC oscillates around zero, and the scale for Price Difference oscillates around zero. With Price Difference the scale values will be based upon the price of the security being analyzed; in this example it was the Nasdaq Composite Index which is in the 7000-8000 price range. And it should be very clear that the lines that make up these 3 indictors are exactly the same shape. Now when someone pontificates to you about which one they prefer you can smile and agree with them, fully knowing it doesn’t matter.
 Chart B
Looking at Chart B on the left it shows the value for Momentum at 98.3051 and Rate of Change at -1.69486. 100 – 98.3051 = 1.6949. Voila!
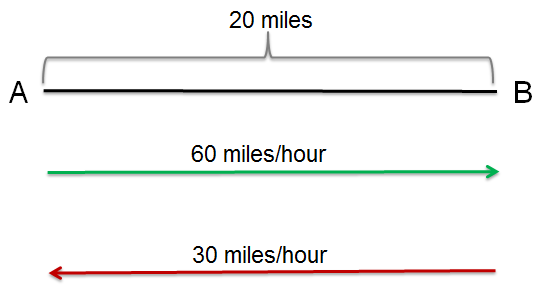
Now I’ll throw a wrench in the gears. You cannot relate rates of change linearly. In Chart C, point A is 20 miles from point B. If you drive 60 mph going from point A to point B, but returning from point B to point A, you drive 30 mph. What is his average speed for the time you were on the road? Think about it before you read on.
- 55 mph
- 50 mph
- 45 mph
- 40 mph
 Chart C
Many (most) will answer that it is 45 mph ((60 mph + 30 mph) / 2). However, you cannot average rates of change like you can constants and linear relationships. Distance is rate multiplied by time (d=rt). So, time (t) is distance (d) / rate (r). The first leg from A to B was 20 miles divided by 60 mph or 1/3 of an hour. The second leg from B to A was 20 miles divided by 30 mph or 2/3 of an hour. Adding the two times (1/3 + 2/3 = 1 hour) will mean you traveled for one hour and covered a total distance of 40 miles, which means the average speed was 40 mph, not 45 mph. Look up harmonic mean if you want more information on this, as it is the correct method to determine central tendency of data when it is in the form of a ratio or rate.
Dance with the Trend,
Greg Morris
