 This article expands on the pair analysis discussed in the previous article. In that article I showed a simple process of trading a ratio of non-correlated ETFs, in particular the S&P 600 Small Cap (IJR) and the BarCap 7 to 10-year Treasury ETF (IEF). Using a 4% trigger to switch from one to the other. Here I expand that concept to build a strategy using 4 different ratios with each one representing 25% of the portfolio. Table A shows the pairs used with an equal allocation of 25% each given to the four pairs. This concept was originally designed to manage a core holding. Many advisors want (need) a strategy that has a portion always invested in equities.
The fact is that these advisors are only following the guidelines their firm insists upon. Most of the large brokerage firms insist on a maximum of 20% in cash or cash equivalents. Hey, there are big commissions on cash. Of course it varies but most that I dealt with would not let their money managers put their clients in cash, or at least not much cash. Hence, here is a core strategy that is always invested and can be any percentage of a portfolio.
 Table A
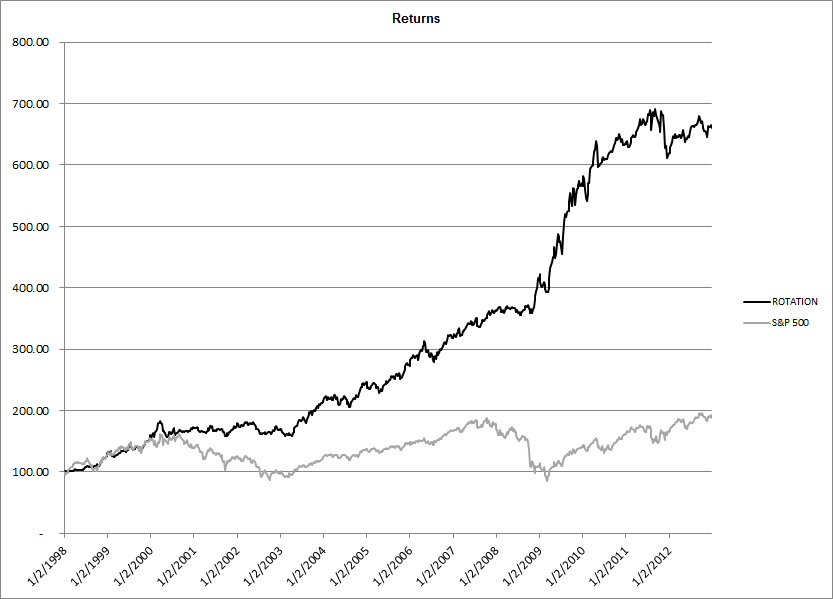
Chart A shows the results using the four different pairs in a core rotation strategy compared to buy and hold of the S&P 500. The drawdown in 2008 was limited to only 14%, and other than that, it was a nice comfortable ride. The average drawdown (see Table B) is only about 20% of the maximum drawdown. I was curious about the lack of performance in 2012 and found it was the fact that in the Gold / 20 Year Treasury pair gold was the holding the entire period.
 Chart A
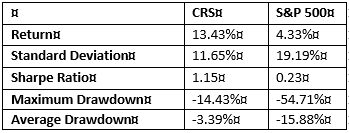
Table B shows the performance statistics for the Core Rotation Strategy (CRS) compared to the S&P 500. In this rotation strategy example each of the pairs were smoothed by their 2-period average prior to measuring the 4% rate of change. This process removes many of the signals and while not affecting the results that much, reduces the number of trades significantly.
 Table B
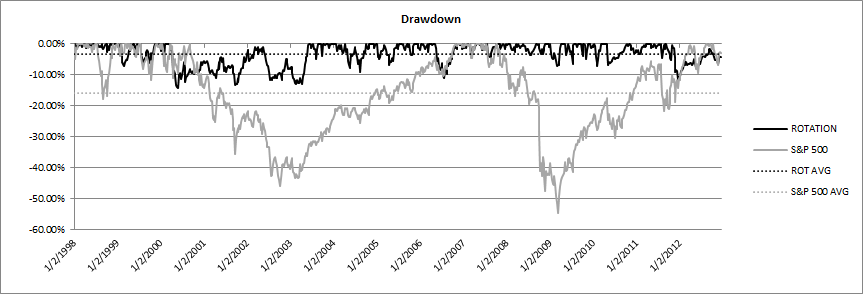
Chart B is the drawdown of the core rotation strategy compared to the S&P 500. You can see that the cumulative drawdown for the rotation strategy is considerably less than the drawdown of the S&P 500 index. The average drawdown for the rotation strategy was -3.39%, while the average drawdown for the S&P 500 was -15.88%. This would make for a very comfortable core holding, considering the exceptional returns and reduced risk statistics from just holding the index in a buy and hold situation. This core rotation strategy still meets the requirement of an always invested core while actively switching between four pairs of equity, gold, and fixed income ratios.
 Chart B
An idea I’ve had but never followed up on is to build a series of 8-10 ratios and then rotate into the 4 best performers on a relative performance-based measure. You could model it after the hundreds of sector rotation strategies that are out there. I have never cared for the rotation to be based upon a calendar time period; much prefer something based upon relative performance among the choices.
Like all strategies or models, I write about, the one thing that will cause this to not work, is the lack of discipline to follow it. Even when it appears that it is not working; that is the time you must follow it. Discipline is the key to model success.
Dance with the Trend,
Greg Morris


