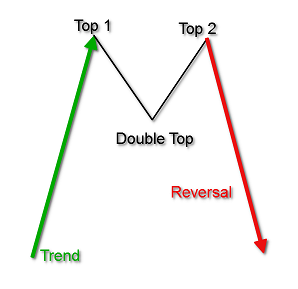
 I developed this method primarily for candle pattern identification when I wrote my book, Candlestick Charting Explained (the book was first published in 1992 and now is in its third edition). The reliability concept equally applies to any type of pattern, including the many chart patterns widely used in technical analysis. My argument and complaint about most technical analysts, is that for a reversal or continuation pattern to be identified, you MUST first identify the trend. How can you have a reversal pattern if you do not know what the trend is? What is it reversing? Below I show the analysis process I used.
Measures of Success
The following three assumptions were used in measuring the success and/or failure of the many different patterns:
1. The pattern must, of course, be identified based upon its open, high, low, and close relationships.
2. For the pattern to be identified, the trend must be determined. This is interchangeable with the previous assumption; each must exist in the methodology.
3. Some basis of measurement must be established to determine the success of failure of the pattern.
To make a creditable prediction, you either know the current trend of you do not. Both assumptions and possibilities have been used here.
The Trend is Known
Patterns fall into two general categories: those that indicate a reversal of the current trend and those that indicate trend continuation.
Each day (for each tradeable), a prediction is made about whether the known trend will continue or reverse for each prediction interval. In other words, if today’s close is above the exponential average (trend), then we assume that we are in an uptrend. I should note here that I used a 10 day exponential moving average to identify the short-term trend. The success or failure is measured by the change in this trend over the prediction interval. The prediction interval is the number of days into the future the success or failure was based upon. Prediction intervals refer to the time periods between the actual pattern and some point in the future.
When a pattern occurs, it is offering a short-term forecast on the direction of the underlying market. The prediction interval is the number of days after the pattern that a determination is made as to whether or not the pattern was successful. A prediction interval is a time in the future that measures the pattern’s forecasting ability.
Once a trend starts, the odds are that it will continue. Every student of science or engineering will recognize that this is nothing more than Newton’s First Law of Motion, which says, a body continues in a state of rest or of uniform motion in a straight line unless it is compelled to change that state by forces applied to it. Simply said, it is easier for a market to continue its direction than to reverse its direction.
Therefore, the continuation of a trend is more common than the reversal of a trend. Remember, we are talking about the short-term future here.
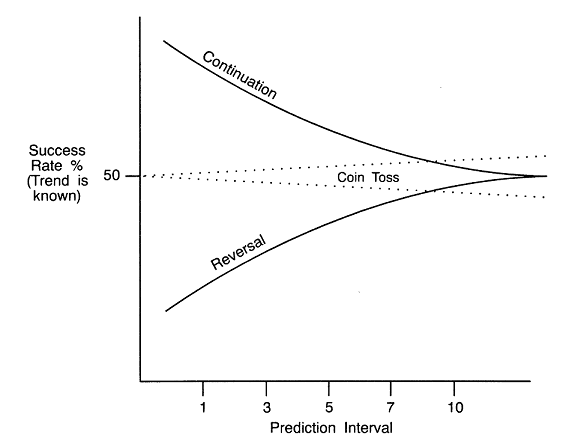
If, at the prediction interval, the price is still above the trend, then the pattern was successful. Simply said: if, during the prediction interval, we are still in an uptrend, then it was deemed successful. If not, it was a failure. Chart A graphically shows the relationship of reversal and continuation patterns with the prediction interval. The relationship of pattern type with prediction interval is based upon the fact that the trend is known.
 Chart A
The Trend is Not Known
Sometimes you do not know what the trend is before making the prediction. In such cases, a coin-toss type of prediction is made about whether the price will go up or down. If you do not know the trend, the odds of its continuing or reversing would fall into the area of 50%. The difference above or below 50% would reflect the directional bias of the data used in the analysis. Again, the success or failure is based upon the price at the prediction interval relative to the change in trend. This fact is also shown in Chart A. Remember, most patterns require that the trend be identified.
Reverse Current Trend and Continue Current Trend
From the computer calculations, two primary parameters are determined: Reverse Current Trend and Continue Current Trend. These are further broken down into Up and Down trends (i.e., Reverse Current Trend Up and Reverse Current Trend Down).
The sum of Reverse Current Trend success and Continue Current Trend success will be equal to the number of days of data used in the testing process. Since a prediction is made each day, Reverse Current Trend success and Continue Current Trend failure would be equal. In other words, the success of Reverse Current Trend, is also the failure of Continue Current Trend.
Reversal patterns (which most are) are compared to Reverse Current Trend and further broken down into upturns and downturns. Since reversal patterns must go against the very trend that defines them, their measure of success would not be as rigid as that of a continuation pattern. In fact, their measure of success could actually be less than that of a coin toss, since they are predicting a change in the current trend, a trend which is supposedly known.
Likewise, continuation patterns are compared to Continue Current Trend. Continuation patterns say that the trend that helped define them is going to continue. Therefore, for a continuation pattern to be considered successful, it must do better than the success of knowing the trend in the first place. Because we know the current trend and we know that the odds are that the current trend will continue; to be useful, continuation patterns must be exceptionally good, or are no better than the trend-identification process.
Bottom Line: Come up with a method to identify the short-term (less than 10-12 days) trend and then the pattern identification process will work much better for you.
Late Note: I was on the treadmill this morning watching Bloomberg when the job numbers were released. They came out well below analysts' expectations and the futures markets sold off. A technical analyst should never fall victim to watching guesses about economic numbers; they will fade away in a few days if not less. I used to show a chart without dates or names and ask folks to point out the earnings reports for the security. They, of course could not do it. Neither can anyone else. They are nothing but short-term noise.
Her Majesty and I are leaving on a 4-week golf, sight-seeing, and grandkids vacation tomorrow. I do have one article ready that I will publish in a week or so and then nothing until our return in early April. Stay well.
Dance with the Trend,
Greg Morris


