 This will wrap up the Pair Analysis series. In this article I will show:
Some basic statistics on the pairs I used in the analysis.
The top 50 pairs based on performance.
The bottom 50 pairs based on performance.
The Sharpe Ratio is a measure of return and risk, with risk being standard deviation. If you have read much of what I write, I think standard deviation is a inadequate measure for risk because it assumes random and normalized data, of which, most stock market data is not. The modified Sharpe is an attempt to make a slight improvement. I have no opinion on it though. I’m sure many of you will find that hard to believe.
Table A shows the symbol, name, return, sigma (standard deviation), and Sharpe ratio for each of the ETFs analyzed. If the ETF wasn’t available back to 1998, the index was used. Remember, the best performing pairs are when the two securities are not correlated.
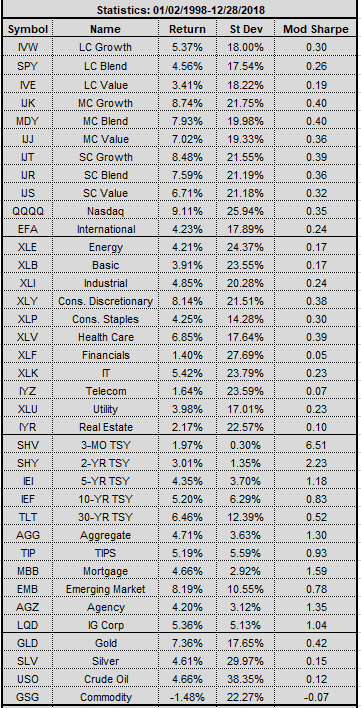 Table A
Table B shows the top 50 pairs based on performance. Keep in mind that the annualized return of the S&P 500 during this time was 4.56%.
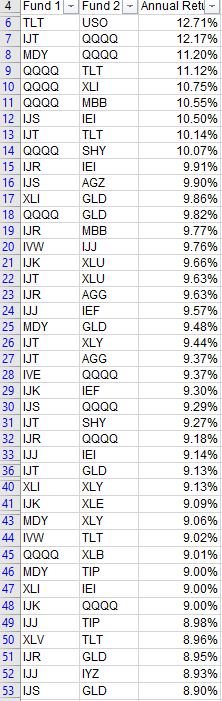 Table B
Table C shows the bottom 50 pairs based on performance. Column headers are the same as in Table B.
Fund 1 (numerator) : Fund 2 (denominator) : Annual Return
Again, the S&P 500 annual return was 4.56%.
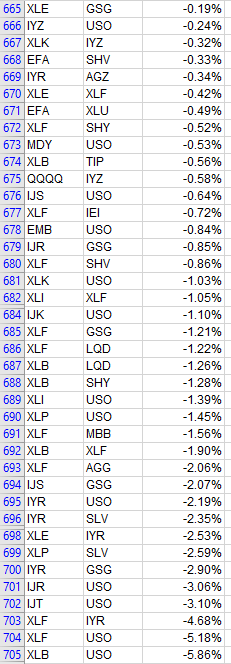 Table C
I am planning on one or two more articles on the Core Rotation Strategy.
Dance with the Trend,
Greg Morris


