 A concept that was introduced to me long ago by my good friend Ted Wong is the use of multiple market indices and measuring their relationship to their moving average. Trend Gauge is comprised of two indicators; Mega Trend Plus and Trend Strength. A concept that attempts to identify overall trendiness in the market is always going to be a valuable tool for a trend follower. For purposes of this example I selected the ubiquitous 200-day exponential average and then smoothed the results with a 3-day arithmetic average. There are a number of modifications one could do with this concept, including optimizing the moving average lengths for each of the market indices. I say that with this warning, optimization must be done properly to avoid curve fitting and was discussed in an earlier article. I would start with moving average lengths that are closely tied to the trend lengths I want to focus on and then use a short-term noise reduction smoothing like I did in this example.
Mega Trend Plus is constructed by selecting 11 major indexes with the longest historical database. One could easily make the case for more or less indices and which indices are to be included. I would suggest using enough indices to give you broad coverage over how you plan to make investments. The Mega Trend Plus is also used in my Long Term Measure (LTM), but in that case it uses weekly data. Clearly if you are going to have a focus on international securities, you would want to include international indices. The list of indices used in this example is:
Nasdaq Composite
S&P 500
S&P 100
Russell 2000
Russell 2000 Growth
Russell 2000 Value
New York Composite
Dow Jones Industrials
Dow Jones Transports
Dow Jones Utilities
Value Line Geometric
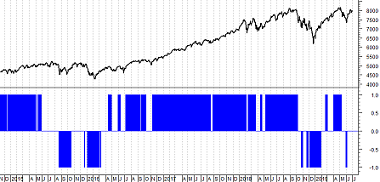
When the index is greater than its Exponential Moving Average (EMA), it receives a +1, below its EMA, it receives a -1. Then the scores from all 11 indexes are summed and then normalized so the composite will have a range between 0% and 100%. An up-trending market is called when the composite is greater than or equal to 85%. A down trending market is the composite is less than or equal to 15%. Once a threshold is crossed, the market stance stays until the opposite threshold is penetrated. Hence Mega Trend Plus is a digital meter: either bull or bear. Chart A shows the Nasdaq Composite in the top plot, Mega Trend Plus in the lower plot, and the Mega Trend Plus binary overlaid on the Nasdaq Composite. The binary is at +1 whenever Mega Trend Plus is greater than or equal to 85, at -1 whenever Mega Trend Plus is less than or equal to 15, and at zero when it is between 15 and 85. You can see that is does a reasonable job of trend identification. This is a weight of the evidence approach that is totally related to the concepts I wrote about in my "Building a Rules-based Trend Following Model" series that I published last year on this blog.
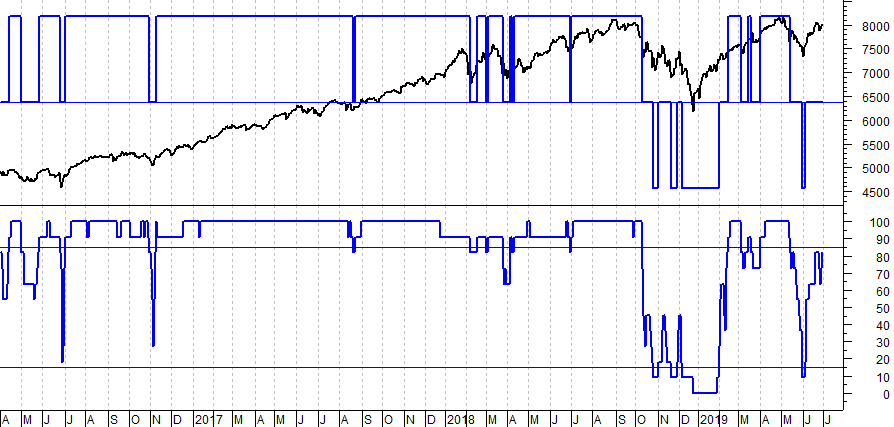 Chart A
Trend Strength is a different composite which is the sum of 11 ratios. For each market index, a ratio is calculated with this formula: (price/EMA-1) x 100%. The EMA lengths are identical to those used in Mega Trend Plus. The ratio depicts how far away (up or down) the index is positioned relative to its EMA. Hence Trend Strength is an oscillating analog meter that measures the momentum of each of the 11 market indexes.
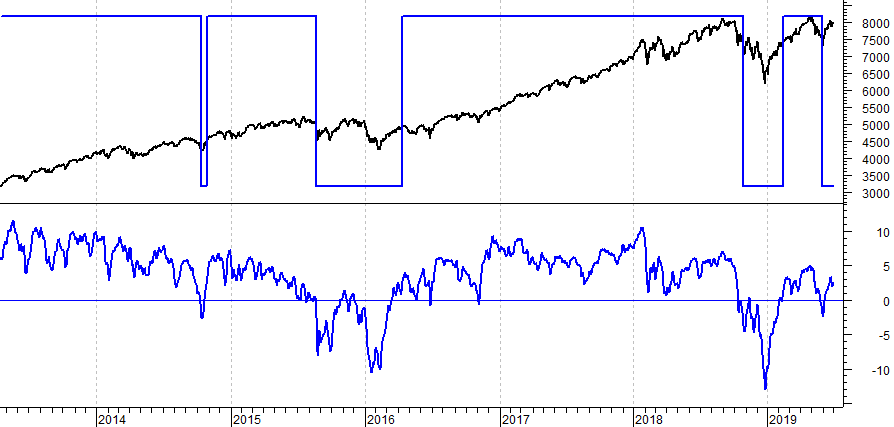 Chart B
Trend Gauge combines the readings from both the digital and analog meters (Mega Trend Plus and Trend Strength). It represents a weight of evidence approach in determining both the direction (digital) and the strength (analog) of the overall market trend. Chart C shows the Nasdaq Composite in the top plot and Trend Gauge in the lower plot. Whenever the Trend Gauge is at +1 it has identified an up-trend, when at -1 it has identified a down trend, and when at 0, there is neither an up or down trend (neutral).
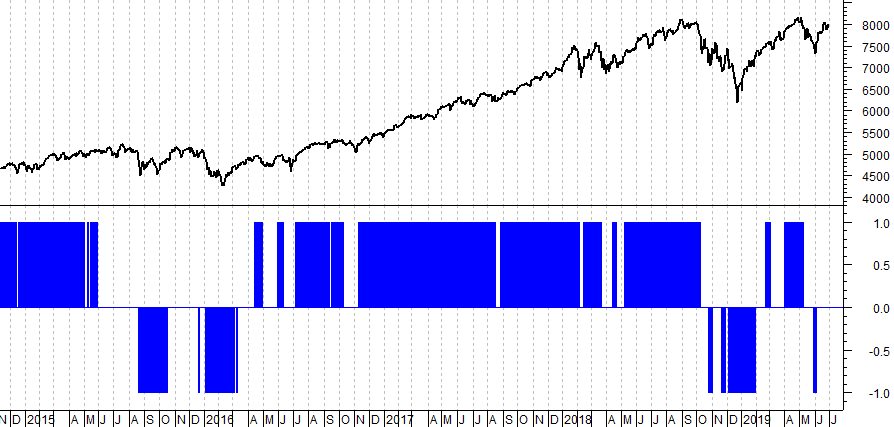 Chart C
Chart D is the same data as in Chart C, just over a much longer time frame. The beginning date in Chart D is 1997.
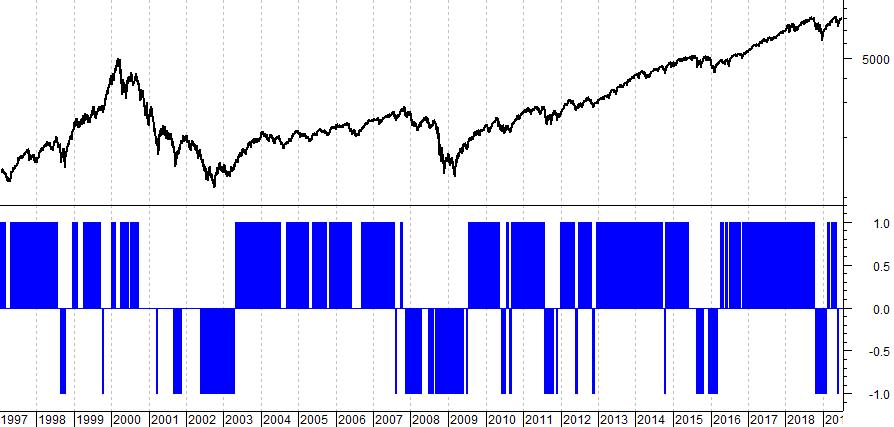 Chart D
Measuring the market is a significant component to a good trend following, rules-based model. This article has introduced some measures that can be used individually or in groups to assist in trend identification. Clearly there were many other measures I have introduced over the years; hopefully you can find a few that will fit your needs. Also, hopefully you will not use all of them as many are similar with minor deviations in their concept. I apologize for putting indicators in these articles that are not part of Stockcharts.com's symbol catalog. Maybe someday they will be.
Ted Wong has a website at:www.ttswadvisory.com. He publishes many wonderful studies on market randomness and modern portfolio analysis.
This will be my last article for a while. I'm not going away, just taking August off. When I return I'll focus more on my trend following models and money management.
Dance with the Trend,
Greg Morris


