As I have stated a number of times, I have used a rules-based trend following model to manage money since 1996. I have found this to be the best approach to investing long-term, as it has the ability to provide above-average compounded returns over time with far less volatility and drawdown. The goals of investing, for most people, are to have your money generate a return AND be available for you at some point in the future. I think that trend following greatly enhances the odds of successfully obtaining both goals – by avoiding major losses (i.e., bear markets), you are more likely able to withdraw from your investment accounts when you need to – not just when the market is cooperating. My latest book, Investing With the Trend, thoroughly discusses and provides market-based evidence of these benefits.
In my last article, "It is Time for a Change," I mentioned that my son, Grant, and I have a trend following model that he has been using to manage real money since 2016. The model is focused on U.S. equity markets only, and is primarily geared to the Nasdaq Composite. There are numerous reasons why we focus on the Nasdaq, some of which have been discussed in previous articles (like here: Building a Rules-Based Trend Following Model - 6). I may expound on those in a future article, but for today, I just want to show some charts demonstrating the ability of a trend following model to participate in the good times and avoid most of the bad times.
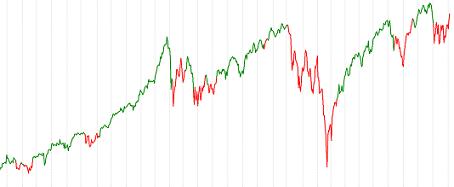
The below charts show a plot of the Nasdaq Composite Index through various points in time, with the line shaded either green or red. The Nasdaq line is green when our model would have called for us to have some percent of assets invested in U.S. equities, and the line is red when our model called for us to be 100% defensively positioned, either in cash or in other non-equity ETFs.
Chart A goes from the beginning of 1979 through August of 2019 (log scale).
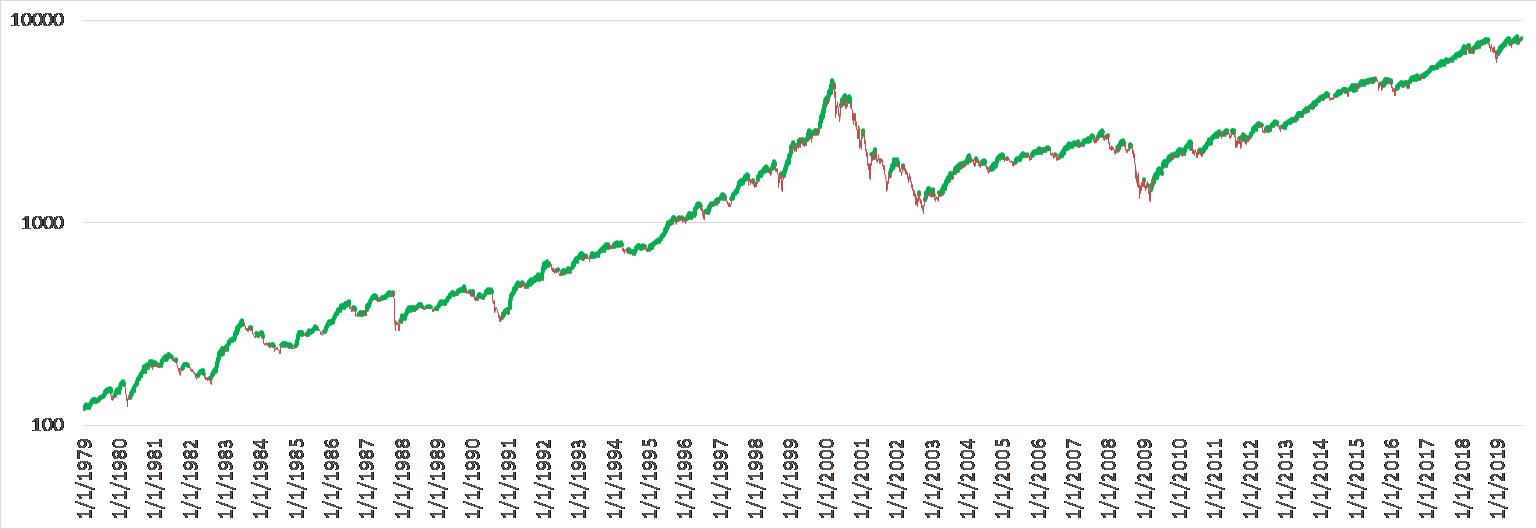
Chart A: 1979-2019
Even without reviewing any performance numbers, this chart allows you to see that the model does a good job of participating in most of the up moves and it avoided most of the major down moves (i.e., large corrections and bear markets).
Chart B shows the model for the entire year 2017. 2017 was a trend follower's dream, as the market was generally trending up with limited pullbacks. You can see two areas in which we were taken out of the market; one in late March for only a few days and the other in August.
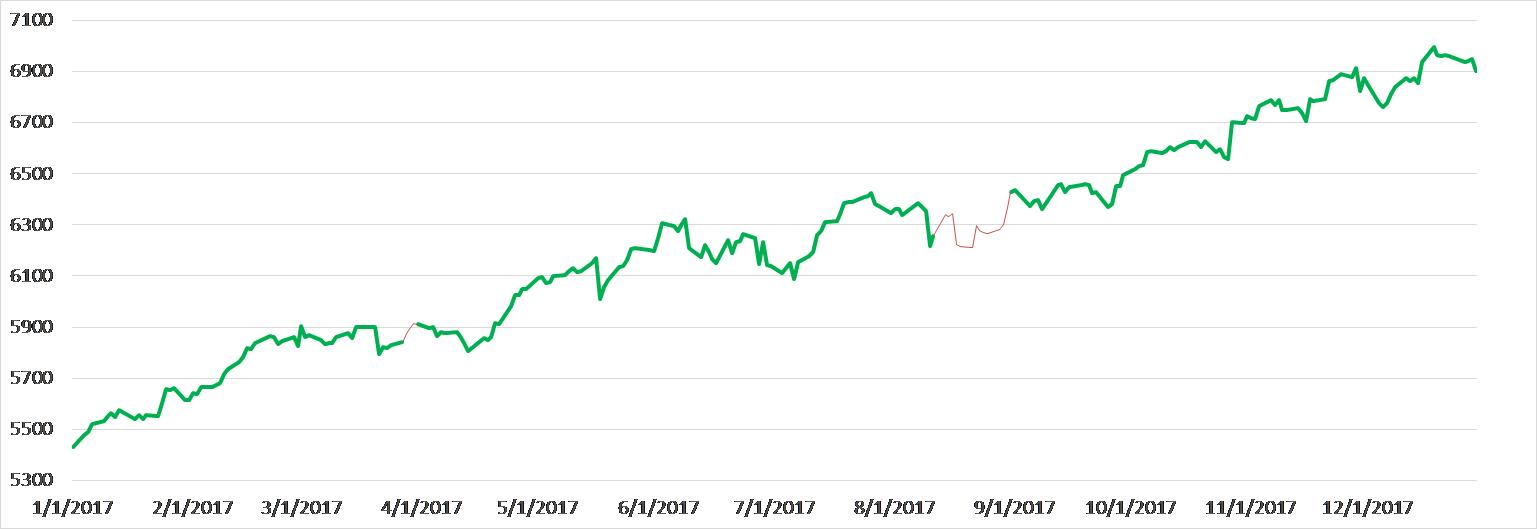
Chart B - 2017
Chart C shows the entire year of 2018, which was a different environment for trend following altogether. The year started off great, with the strong up-trend from 2017 continuing through January, but that was immediately followed by a choppy sideways-market in the Spring that resulted in a few whipsaw trades in our model. The market then had a decent up-trending market from May through the end of September, which was followed by a major correction (nearly a bear market) in the 4th quarter. 2018 was no doubt a wild ride for trend following, as well as many other investing strategies, even buy & hold/passive investing. Trend following models are not "perfect" and are not designed to make money in every environment, but very importantly, when the market eventually started down in October, our stops took us defensive where we remained for the rest of the nearly 20% decline. Protecting capital in defensive positions is a very comfortable place to be during tumultuous market events.
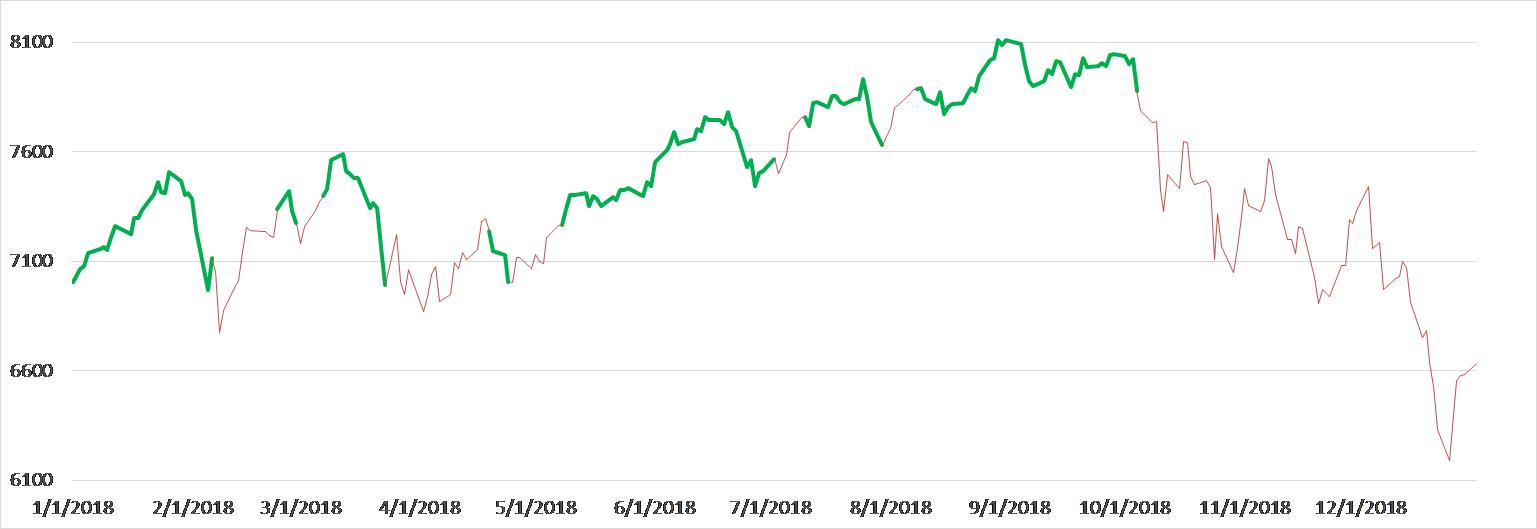
Chart C - 2018
Dance with the Trend,
Greg Morris


