Our rules-based trend following model is the foundation for three different money management strategies. This article will introduce you to two of them. Our model uses a weight-of-the-evidence approach to measure the strength of up-trends in the U.S. equity markets and is primarily focused on the Nasdaq Composite Index (as discussed in a previous article, It is Time for a Change).
Some traders apply trend following indicators and techniques directly to the instrument they are trading, such as individual stocks, futures, or currencies. Those approaches are often deployed by CTA (Commodity Trading Advisor) firms, hedge funds, and a handful of RIAs or individual financial advisors. Our approach is different in that we are merely focused on answering the question "is the US equity market in an uptrend, and is it strong enough that we want to participate?" Based on our model's answer to this question, the next decision is how to "participate" when the model calls to be either invested or defensive.
The decision on how to participate is what drives the different strategies that are in use today. The trend strategy most closely resembles the underlying model (trading in and out of the index). There is an ETF called ONEQ which is representative of the Nasdaq Composite Index but does not trade in high volume. Low volume means trade execution would be very poor (average spread is $0.56...yikes!). Therefore, we trade the QQQ and ITOT instead of ONEQ. The actual allocation in the two ETFs, when the model calls for equity exposure, is to trade 80% of the investment amount in QQQ and 20% in ITOT. Like the model, the strategy goes to cash when the model signals to be out of the market. Cash in most cases represents a money market fund.
QQQ is the obvious choice for Nasdaq trend following, as it is one of the most liquid ETFs and has the highest correlation to the Nasdaq Composite Index (besides ONEQ that isn't tradeable). In order to pick up broader market activity, as opposed to just the large- and mega-cap included in QQQ, ITOT is used along with QQQ while on offense. ITOT is a very high-volume broad market ETF with a low expense ratio, and serves to add mid-, small-, and micro-cap exposure to the QQQ position. A 20% allocation was meaningful enough to make a difference but not so much as to reduce the high correlation to the Nasdaq on offense. The goal of the model is to tell us when to invest in U.S. equity markets with a focus on the Nasdaq, and the combination of these two positions gives the strategies the equity exposure that aligns to the model.
There are countless other ways one could invest if you identify that the market is in an uptrend. Some technical analysts would prefer to rank individual stocks based on other technical measures, and trade those when an uptrend is in place. For us, we don't want a system that is overly complex, and don't want to get cute with individual stock selection to drive additional alpha (often it doesn't) – the approach of the strategies is just to get boring market exposure during uptrends, i.e., cheap beta, and that's why the strategies only use these index ETFs.
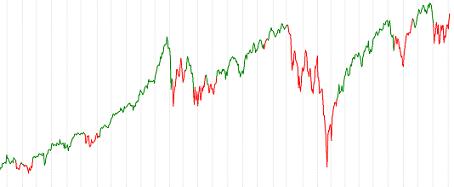
Chart A shows the Nasdaq Composite Index (black), QQQ (red), and ITOT (green). An explanation that they are very closely correlated is hopefully unnecessary.
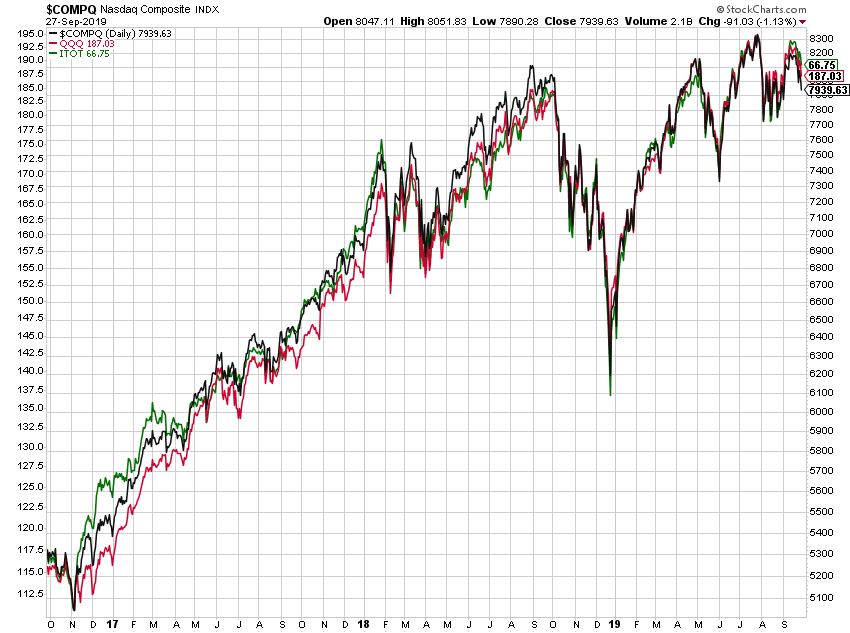
Chart A
Correlation is a statistical measurement showing the strength and direction of a linear relationship between two data sets. Known in statistics and finance as R, it is used to determine the degree of correlation, with a value of 1 showing perfect positive correlation and a value of -1 showing perfect negative correlation (and 0 being no linear relationship).
Table A shows the correlation in daily returns for the Nasdaq Composite Index (^IXIC), QQQ, and ITOT over the past 10 years.
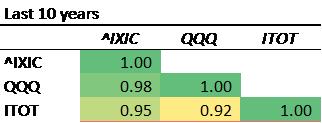
Table A
We think it is obvious that what is actually being traded in the strategy is very close to what is used in the model (Nasdaq Composite Index).
The other trend strategy is exactly the same when the model calls for equity market exposure. The only difference is that instead of going to cash when the model calls for a defensive position, Trend Plus goes into two defensive non-equity ETFs. The defensive allocation is 80% to IEF (7-10 Year Treasury Bond) and a 20% allocation to GLD (Gold Shares).
IEF and GLD were primarily selected because of their low to negative correlation with Nasdaq – and clearly negative correlations during periods where the model is defensive (i.e., when the model is defensive and the Nasdaq is going down, these usually are going up). The real-world explanation for the negative correlation is that investors have historically made a flight to quality as the stock market sells off. A 100% allocation to GLD actually performs the best, if one is only concerned with returns, but doesn't do as well at reducing volatility and drawdown. IEF helps a lot with that. A 20% position in GLD was enough to make a positive difference on returns, but not too much to increase volatility and drawdown. All of the positions in Trend and Trend Plus were carefully selected with an eye toward low-cost highly-liquid ETFs that can be traded in and out of easily.
Table B adds to Table A the correlations of IEF and GLD.
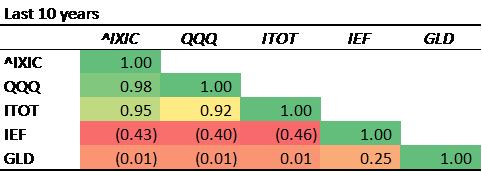
Table B
You can see that the daily returns of IEF and GLD are negatively correlated to the Nasdaq (IXIC). Keep in mind we have not discussed performance on any of these strategies; we plan to eventually.
Dance with the Trend,
Greg Morris


