In 1988 I attended an MTA event at the Camelback Inn in Phoenix. At the conference there was a large contingent of Japanese traders present and they presented their charting techniques. It was the first time I had ever heard of "Hi Ashi," which is what the Japanese call their candlestick chart. I was working with N-Squared Computing then and we decided to create a charting product using Japanese candle patterns with automatic recognition capability. I traveled to Japan and stayed with Takehiro Hikita who was an active red bean and rice trader from Yokohama. I knew Hikita-san for years as he was a devoted customer of N-Squared Computing. He was intent on teaching me the art of candlesticks and also helping to translate most of the books that were available in Japan. Hikita-san was often fond of saying, "Dance with the Trend." And now you know where the blog title come from.
I was approached by a publisher in 1989 to write a book on Japanese Candlesticks. I remember telling him that I just did not have the time. He said it would probably help sell a lot of our software; I said, where do I sign. The book is now in the third edition with considerably more material than the previous two. As an engineer I treated the book as a research project; I certainly did not want to try to sell anyone on using candlesticks. I was very abrupt with my comments on what worked and what didn't. The book has been selling well since 1991. In 2012, because of robust sales, McGraw-Hill wanted me to write a workbook for Candlestick Charting Explained. I did and it also sells very well. Chart A below shows the sales for the past year for the two books and these are only the sales from Amazon. The red line is the book and the gold line is the workbook. I like to say that for almost 30 years these books have kept me in beer, cigars, and golf clubs. And no, you cannot find chart patterns or draw trendlines on data that does not trade.
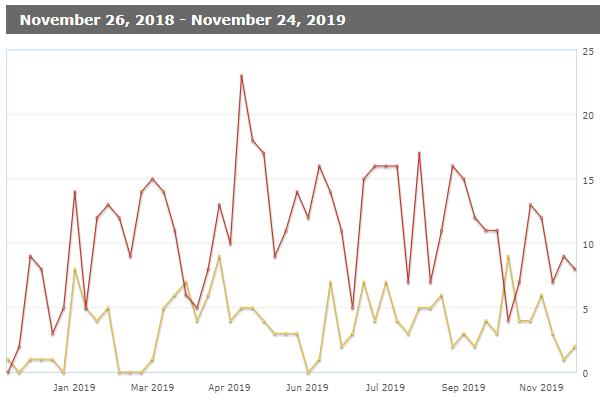
Chart A
In the book I introduce a filtering technique to use with Japanese candlesticks that greatly improves their ability to measure reversals and continuations in market trends. Remember, candlesticks are only for short term analysis - certainly less than 5-7 days.
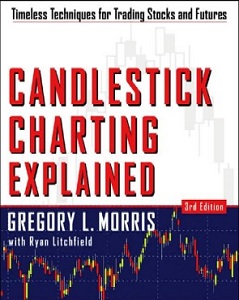
Candlestick Charting Explained has been published in over 6 languages. The book takes the subjectivity out of Japanese candlestick analysis by providing you with standardized, straightforward coverage of 89 powerful candlestick patterns. You will learn what they indicate about current trader behavior and how you can use each to instantly improve you market knowledge and analytical precision.
The Candlestick Charting Explained Workbook is packed with study questions, data tables, diagnostic tools, terminology, sample charts, and market analysis. It greatly helps you speed up the learning process. The Workbook, along with the main book, provide enormous amounts of statistics on each candle pattern. The Workbooks shows you how to determine what patterns work best in different markets.
Comments from the cover:
"Arguably the best book on candles, tying them together, as it does for the first time, with traditional technical analysis. The technique of uncovering the psychological component in chart patterns is yet another powerful tool, carefully explained in this long-needed and valuable book." John McGinley, Editor, Technical Trends.
"Greg Morris explores a powerful avenue for achieving better trading results in this book. The juncture of pattern recognition (using candlesticks in this case) and indicator interpretation is fertile ground for the development of a rational approach. My own research suggests that trading techniques along these lines offer powerful solutions to many of the problems that confront the trader in the day-to-day decision-making process." John Bollinger, CFA, CMT, President, Bollinger Capital Management.
Here is a link to StockCharts.com's bookstore for my books - Click Here. Use this code: BREADTH for an additional 15% off. This discount is only good until December 31, 2019.
Dance with the Trend,
Greg Morris