A few years ago StockCharts.com vastly updated not only its raw breadth database but now there are hundreds and hundreds of new market breadth indicators available to everyone. This is not really an article but an information piece about StockCharts.com's vast amount of breadth material and where to find it; plus, a little sales pitch at the end I thought I would just throw in. And just to help validate it all for many years I managed a lot of money using a large percentage of indicators that used breadth data.
An Example of the Value of Breadth
Market tops, also referred to as periods of distribution are usually lengthy, volatile, and extremely difficult to pinpoint the actual top except for the always perfect 20-20 hindsight. As traders and investors watch the market action and the financial media shows the major indices every market day (every 5 minutes), you must realize that all of the major indices like the S&P 500, NYSE Composite, and Nasdaq Composite are capitalization weighted indices. The Dow Jones Industrial Average is a price weighted index and performs similarly. Capitalization and price weighted indices are controlled or driven by their largest components, let's say the ones that make up 10% of the index can account from 35% - 45% of the indices' movement. At one point the top 10 stocks in the Nasdaq 100 index accounted for 46% of its movement.
After a long bull run in the market and prices begin to become more volatile and the overall up trend has been reduced, it is not uncommon for investors and traders to seek some safer holdings. These holdings are generally large-cap and blue-chip stocks; they exit out of their riskier holdings such as growth and small-cap stocks. This unified action causes the capitalization weighted indices to continue to move higher as more and more investors sell the small and mid-caps for perceived safety in large caps. Breadth on the other hand, where all stocks are created equally, will show a declining trend.
Let's take the year 2007 as an example to show the importance that breadth contributes to market analysis. After a good bull run from early 2003, the market's overall trend was reduced early in 2007 but still making higher highs. Breadth, using the ubiquitous advance decline line, declined during the entire year (see chart A). This is because fewer and fewer stocks were participating in the perceived rally. The Troops were no longer following the Generals. My friend Tom McClellan likes to say that breadth arrives at the party on time but always leaves early. Back when I was managing money, I used a model that consisted of 40% breadth indicators for this very reason.
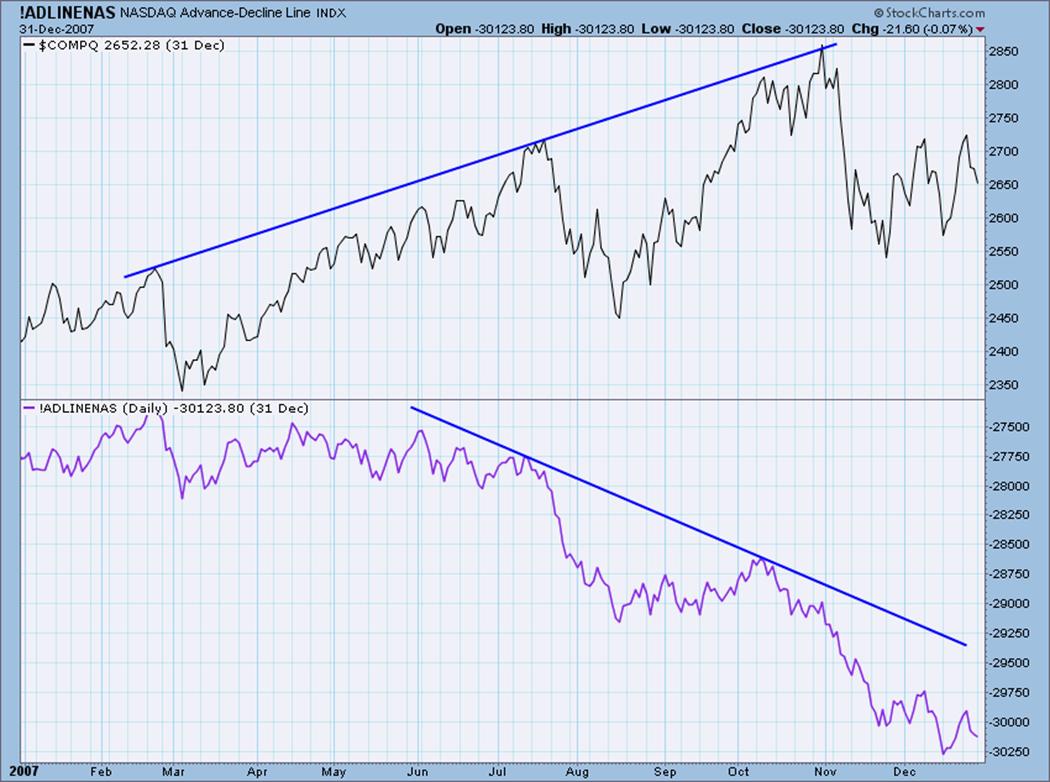
Chart A
After using breath for decades, I would state the following about breadth and market tops. Breadth can and will show deterioration (divergence) while price-based indicators move higher at every market top, it also can and will display it at times when there is only a pullback or correction. One cannot assume that a divergence with price and breadth will be a trading opportunity, but it will always be a time to become more alert. This is not unlike many economic indicators, recalling the humorous adage that the Index of Leading Indicators has called 18 of the 12 recessions. Remember breadth treats all stocks equally. Exxon Mobile could be up $35.00 one day and Bubba's Pizza could be down $0.01, and they would cancel each other out using breadth.
There are 3 sections below, one for the New York Exchange data, one for the NASDAQ data, and one for the Toronto TSX data. The raw data symbols and their starting dates are included for both the daily data and the weekly data. After each table are links to various other breadth data and indicators in StockCharts.com's Symbol Catalog.
New York Stock Exchange (NYSE)
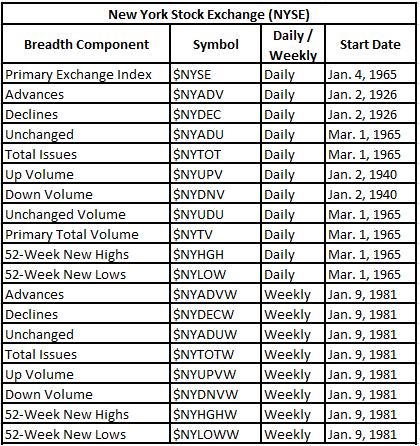
Table A
To access this data in the symbol catalog, search on $NY.
To access all of the New York breadth indicators in my Complete Guide to Market Breadth Indicators book, search on: !BINY or click here.
NASDAQ Exchange
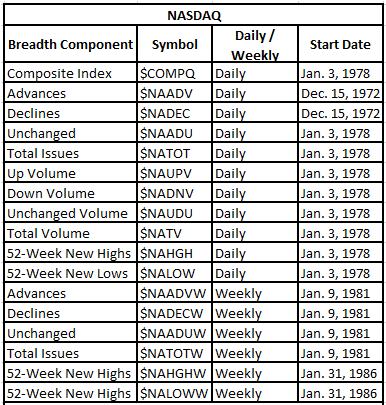
Table B
To access this data in the symbol catalog, search on $NA.
To access all of the New York breadth indicators in my Complete Guide to Market Breadth Indicators book, search on: !BINA or click here.
Toronto Exchange (TSX)
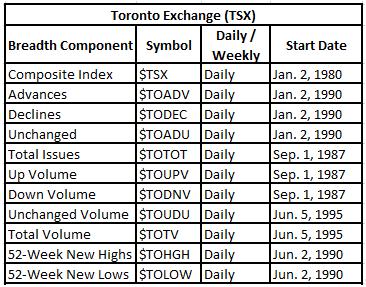
Table C - Note: weekly breadth data is not available on Toronto Exchange.
To access this data in the symbol catalog, search on $TO.
To access all of the New York breadth indicators in my Complete Guide to Market Breadth Indicators book, search on: !BITO or click here.
If you search on: ! (exclamation point), you will find a vast amount of breadth indicators of Carl Swenlin' s and others, including symbols for common stock only series.
In 2015, that after over a year of work with many of the fine folks at StockCharts.com, the 2nd edition of the book is now available in Kindle format from Amazon. You can click HERE to go to the Amazon page. I priced it to sell – only $19.99. It has lots of new material from Tom McClellan, George Schade, and Dick Arms, plus all of the charts are from StockCharts.com. Plus, an entirely new chapter (11) on non-internal breadth indicators.
And even more good news, we (StockCharts.com and I) have created a ChartPack that has all of the charts in the book, not only for the New York Exchange (in the book), but also for the NASDAQ Exchange and the Toronto Exchange. The ChartPack has 187 charts for the NYSE, 187 for the NASDAQ, and 148 for the TSX Toronto. Toronto is slightly fewer because not all of the breadth data was available, in particular, the weekly breadth data. CGMBI ChartPack – Click Here. This ChartPack means that you have every chart in the book plus the NASDAQ and TSX versions updated each day (each week for weekly data). The ChartPack is only $49.95 and is good as long as you are a subscriber to StockCharts.com. The other really nice feature of publishing with Kindle is that if I want to add something to the book, say I discover a new breadth indicator, I can do so. And everyone who bought the book will receive the update for free.
The reason I wrote my "breadth" book is because it had not been adequately covered before. Most of the large all-inclusive tomes on technical analysis only covered breadth in a chapter or two.
Here are the dust cover comments from the book:
"This book should be called the Encyclopedia of Market Breadth because it includes every form of market breadth known to man. A must for any serious student of this important and overlooked subject." Martin Pring, Author, Technical Analysis Explained.
"In The Complete Guide to Market Breadth Indicators, Greg Morris passes along his many years of experience, describing the market breadth indicators that he finds most effective." Sherman McClellan, Publisher, The McClellan Market Report.
"This is clearly the definitive work on breadth. From basic to advanced applications, Greg Morris has included it all in this book – including thoughts on the continuing validity of the data." Larry McMillan, Author of Options as a Strategic Investment, McMillan on Options, and Profit with Options.
"Rich in detail yet easy to digest and understand. Greg Morris has left no stone unturned in writing what is clearly the leading resource on stock market breadth." Tim Hayes, CMT, Chief Investment Strategist, Ned Davis Research.
"Greg Morris has done a great job of assembling a large variety of indicators based on market breadth data. More importantly, he has illustrated why breadth data is so important to market analysis." Tom McClellan, Editor, The McClellan Market Report.
Go ahead; treat yourself to a really nice Christmas gift. The cost of the book and the chartpack is less than $70. Since the book is a Kindle version it is only available on Amazon - Click Here.
The ChartPack is only available from StockCharts.com - Click Here.
Trade with Good Breadth,
Greg Morris


