 I will attempt to show that high sigma is a much more frequent event than modern finance thinks it is. A few examples using the Dow Industrials back to 1885 on a daily basis are shown. Each begins with determining a look-back period to determine the average daily return and the standard deviation, and then a look-forward period is determined to see if the look-back data continues into the look-forward data. Figure A is an attempt to help visualize this process. A look-back period is determined (in-sample data) and a look-forward period is also determined (out-of-sample data). The look-back period is used to determine the average daily return and the standard deviation of returns. From that data, a range of three sigma about the mean is determined. Then in the look-forward data, the number of daily returns outside the +/- three sigma band are tallied with the total being displaying as a plot; any point on the plot represents the data used in the look-back and the look-forward periods.
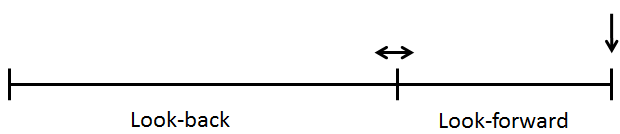
Figure A
In Chart A, a look-back period of 1260 days (5 years) is used to calculate an average daily return and the standard deviation of returns. On 10/24/2002 (last peak on Chart A) the average return over the past 1260 days was 0.07%, and the standard deviation over the same period was 0.71%. Therefore a 3 sigma move up was up to 2.21%, and a 3 sigma move down was -2.06%. The look-forward period, also 1260 days, is counting the number of days in which the returns were outside of the look-back range. There were 49 days with returns greater than 2.21% and 69 days with returns less than -2.06%, for a total number of days with returns outside the +/- 3 sigma range (based upon the previous 5 years) equal to 118. Table A puts this into another format.
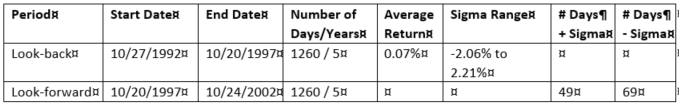 Table A - Table Showing data in Chart A
For a +/- 3 sigma event the expected number of observations should be 1.7, whereas there were 118, which is 59 times more than expected (events must be in whole numbers so used 2 for the expected number). Chart A shows the 1260 day rolling total number of days outside the +/- 3 sigma range. As of 12/31/2007 the total is 116, with an expectation of only 1.7. This is over 58 times more returns outside the +/- 3 sigma band than expected. Of those 116 days outside the three-sigma band, 54 were above 2.45% and 62 were below -2.37%.
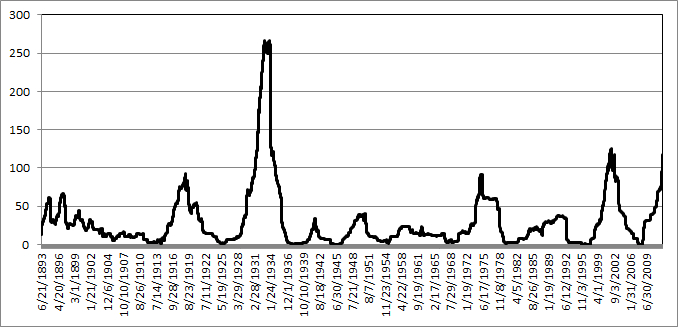 Chart A - Five Year Look-back and Five Year Look-Forward Days outside +/- 3 Sigma
Reducing the look-forward period to one-year (252) days while maintaining the five-year look-back period yields Chart B of rolling number of days outside a +/- 3 sigma (standard deviation) event. Remember that the determination of +/- 3 sigma is determined by the previous five years of data at any point on the chart. For a one year look forward there is only an expectation of 0.34 events (days) outside the sigma band.
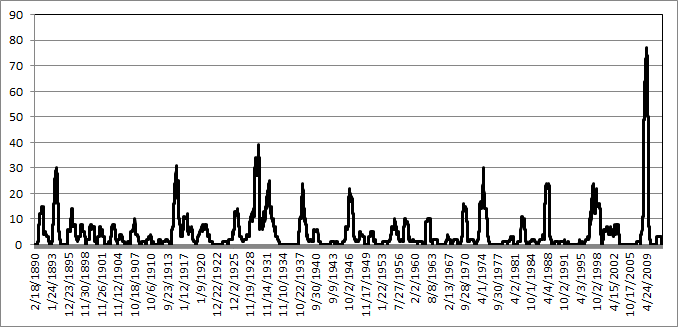 Chart B - Five Year Look-back and One Year Look-Forward Days outside +/- 3 Sigma
Keeping the look-forward period to one year and expanding the look-back period to twenty years (5020 days) is shown in Chart C. Extrapolating the past into the future always has its surprises. Keeping the look-forward period the same (one year) and increasing the look-back period does not significantly affect the rolling returns outside the sigma range.
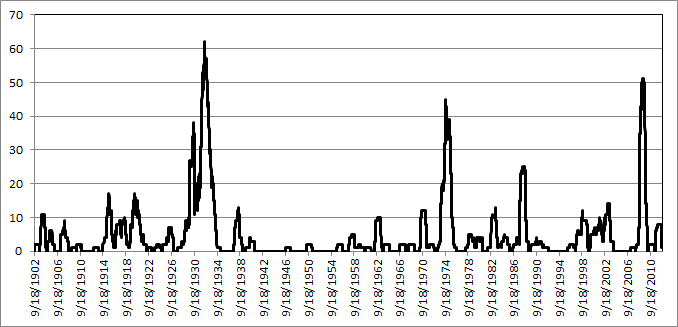 Chart C - Twenty Year Look-back and One Year Look-Forward Days outside +/- 3 Sigma
Bottom Line: Gaussian (bell-curve) statistics are not appropriate for market analysis, yet modern finance is totally wrapped up in using standard deviation as volatility and then saying that is risk. There are actually two big problems; one is the use of standard deviation to represent risk and two is that past standard deviation has very little to do with future standard deviation. The first problem does not account for the fact that standard deviation (sigma) is also measuring both upside moves and downside moves with no attempt to separate the two. Clearly, upside volatility is good for long only strategies. The second problem was covered in this article showing how inadequate standard deviation is from the past in predicting how it would be in the future. I apologize for this nerdy article, but too many confuse normally distributed data with stock market prices. Please don't or you will forever wander in confusion.
Dance with the Trend,
Greg Morris


