In my ChartWatchers article last weekend, I reviewed the sentiment charts in the DP Gallery. I thought it would be interesting to see what's happened since then. Bullish sentiment continues to rise.
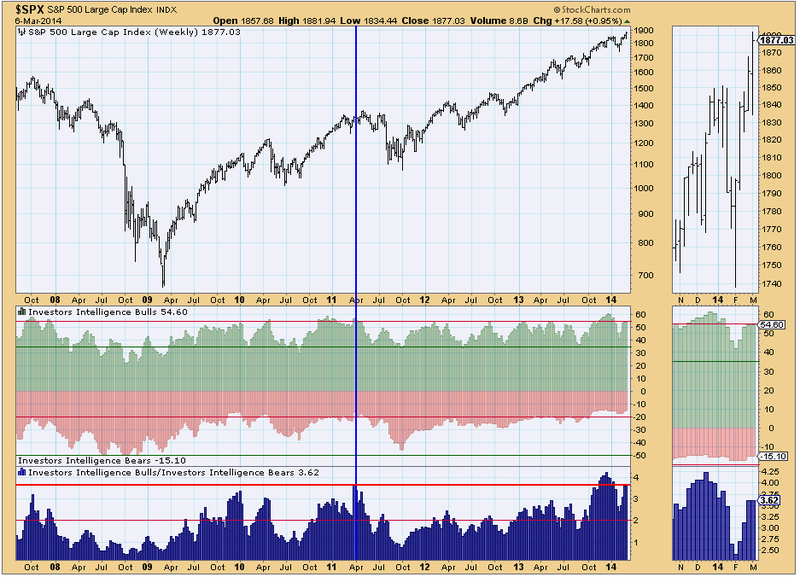
Investor's Intelligence surveys over a hundred independent market newsletters and assesses each author's current stance on the market: bullish, bearish or correction. The results are below in the chart from the DecisionPoint Gallery. For a live version, click on the chart.
The percentage of bulls is about the same, but there are fewer bears. As a result, we saw an even higher reading for the Bull/Bear ratio. Last week it hadn't hit the top of the range but it has now. Note that in 2011, a similar reading was reached before the 2011 correction. However, December's readings were even higher and while they accompanied a correction, it wasn't nearly as deep as 2011.
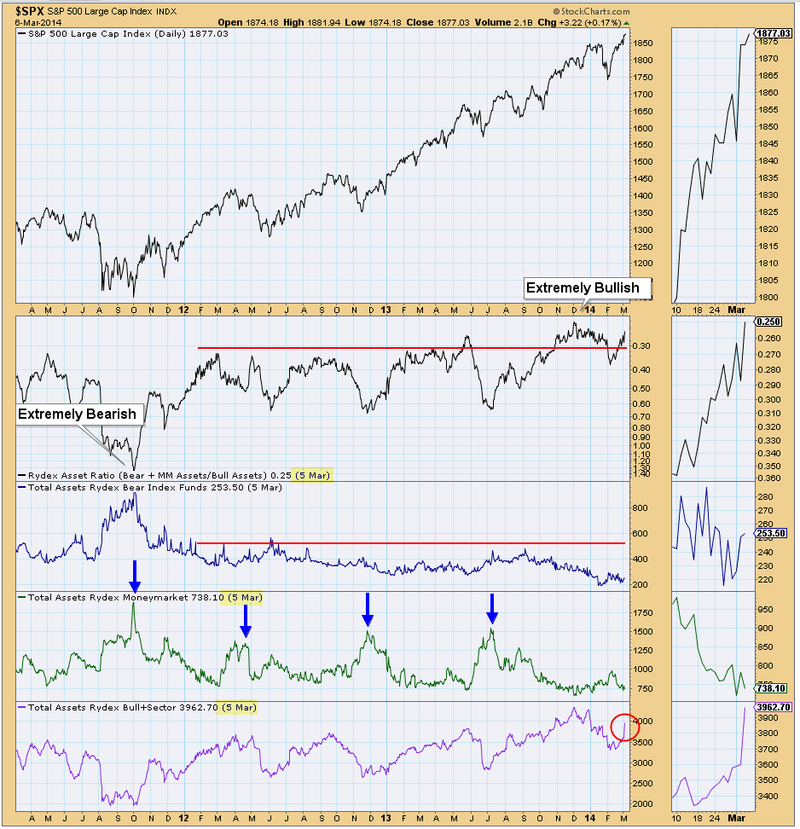
The Rydex Asset Ratio, adapted by Carl Swenlin from Steve Todd's original, is a unique way to measure sentiment. Rydex is an unusual mutual fund company in that it publishes the total dollar amount of assets in each of its funds on a daily basis. This makes it possible for us to analyze sentiment based upon what investors are actually doing with real money. We do this by calculating a daily bear/bull asset ratio and monitoring the relationship between assets in the two types of funds.
Because we don't receive asset information until hours after the close, you should be aware of the date of the last update noted in parentheses. The chart below shows data from Wednesday, March 5th.
Let's look at the bottom pane and work our way up. There has been a clear increase in assets in bullish funds, though not yet as high as the beginning of Dec. 2013.
Money Market assets have been moving mostly sideways since September of last year. Notice the peaks in Money Market assets tended to coincide with market bottoms. This is logical since investors move assets into cash when they are pessimistic.
The next pane illustrates that assets in bear funds have been relatively even since peaking at the 2011 price bottom.
In conclusion, sentiment in both the survey and Rydex Ratio is very bullish. Readings are starting to reach extremes. Remember that sentiment is generally contrarian, so these charts indicate there could be a pullback.
Happy Charting,
Erin


