Yes! It's Carl. I thought it was about time that I contribute to the new DecisionPoint blog on StockCharts.com. I plan to periodically blog here when I find something of particular interest that I'd like to share, similar to the Chart Spotlight on DecisionPoint.com.
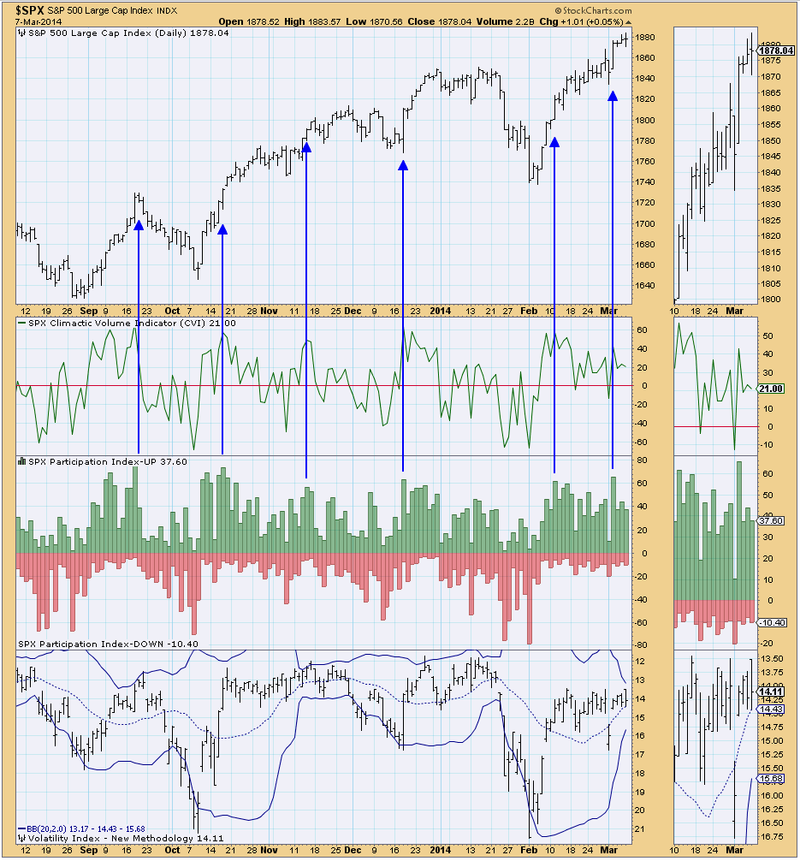
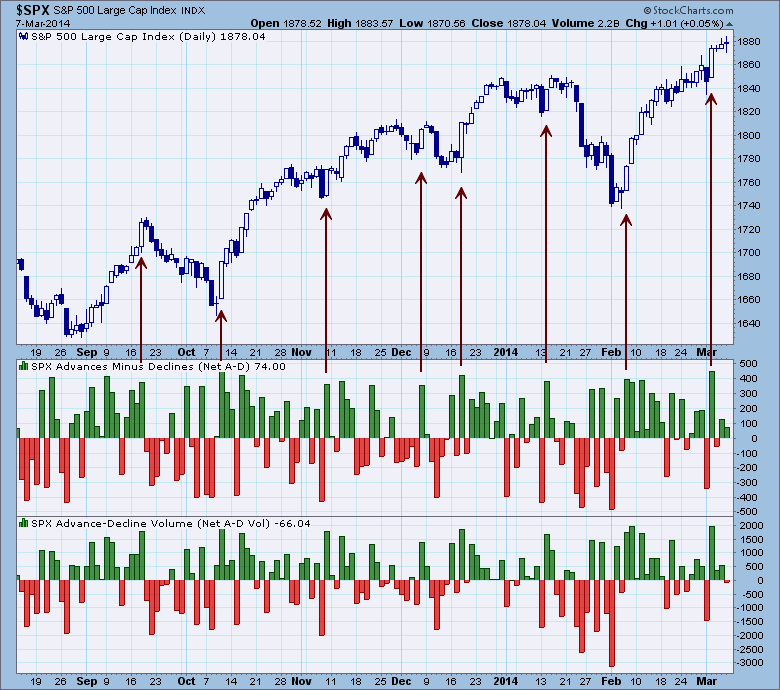
If you look at the volatile or ultra-short-term indicator chart and the Advance-Decline breadth and volume chart in the DP Chart Gallery on StockCharts.com, you will spot recent climactic activity.
First look at the Participation Index - UP. I've annotated climactic readings and the corresponding price action.
I've done the same to the Net Breadth and Volume. (Note: for clarity, I have adapted the Advance-Decline Breadth and Volume chart from the DP Chart Gallery to exclude the A-D lines)
In September the climax marked a price top. In October and February the climax came out of a price bottom and signalled the beginning of a substantial rally. The most recent climax looks more like the ones in November and December, where there were price advances but they were smaller and rolled over into consolidating moves.
Climactic moves can indicate an initiation to higher prices or an exhaustion leading to lower prices. Using past moves for comparison and evaluating the indicators in the DP Chart Gallery can help us determine whether the climax is an intiation or exhaustion.
Watching the windsock,
Carl


