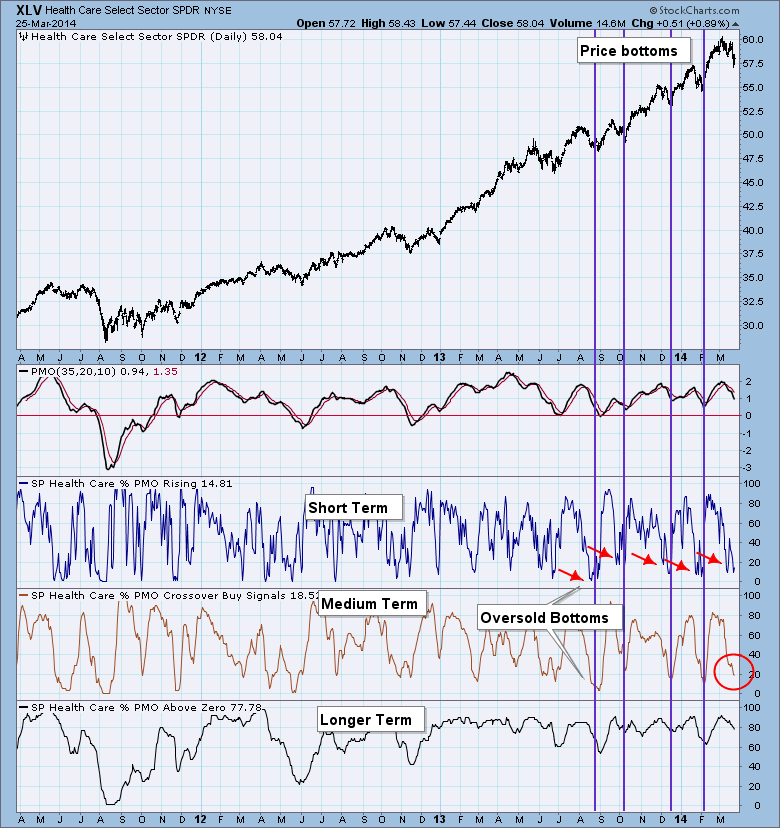
While clicking through the PMO Analysis ChartList in the DecisionPoint Market Indicators ChartPack, I noticed that the PMO Analysis chart for the Health Care ETF (XLV) showed oversold readings. Previous oversold bottoms have lined up pretty closely with past short-term price bottoms.
On a PMO Analysis chart, besides the PMO for the ETF, we use three indicators that are relevant in three different time frames. They are produced by taking the components of the ETF and calculating their PMO values/EMAs.
The short-term indicator is the Percent PMO Rising. This is a short-term indicator because it will be quite volatile as the PMO can change direction frequently. When the PMO is rising, that equates to positive price momentum.
The medium-term indicator is the Percent PMO Crossover Buy Signals. If the PMO is above its EMA, it is on a PMO "Buy". We calculate the percentage of components that are on Buy signals.
The longer-term indicator is the Percent PMO Above Zero. If the PMO value is above zero that indicates a stock has been holding on to positive momentum for some time.
So let's review the PMO Analysis chart for XLV. I noted first that the medium-term Percent PMO Crossover Buy signals reading has hit oversold territory. Like the PMO for XLV, it has not yet bottomed. Note that the short-term Percent PMO Rising while volatile, does tend to bottom just before the medium-term indicator. It has reached oversold and is trying to bottom.
The PMO Analysis ChartList from the DecisionPoint Market Indicator ChartPack contains 17 charts just like the one above. Below is the Summary view.
In conclusion, on XLV these indicators are oversold and could imply that a price bottom is nearing. The Percent PMO Crossover Buy Signals reading and PMO itself have not reached extremely oversold levels and are still falling. However, the short-term Percent PMO Rising has reached the bottom of its range and appears to be turning back up. I believe this is enough to make XLV a 'one to watch'.
Now that you know how to read a PMO Analysis chart, download the DecisionPoint Market Indicator ChartPack and click through this ChartList.
Happy Charting!
Erin


