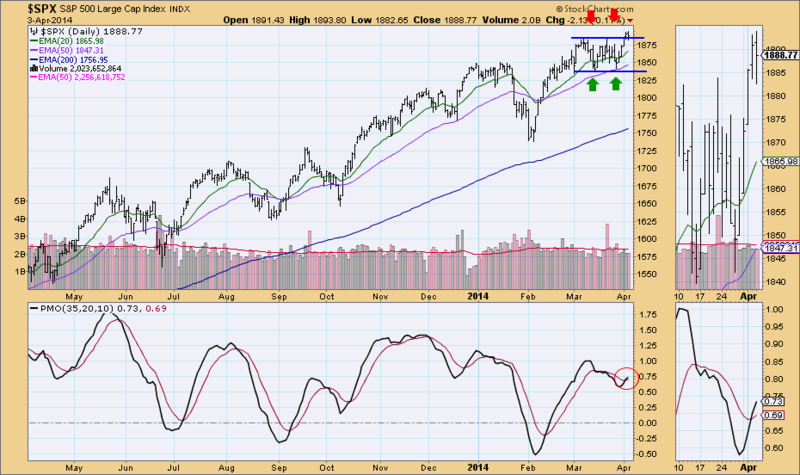
On Monday I wrote a blog "Double-Top to Double-Bottom?". I thought a review and update would be a great follow-up today, especially given the story the charts are telling.
We did get a breakout above the neckline of the double-bottom formation and if you look at this formation as simply a trading range, in that context, overhead resistance was broken. The PMO also had a positive crossover that is promising and could confirm the breakout move.
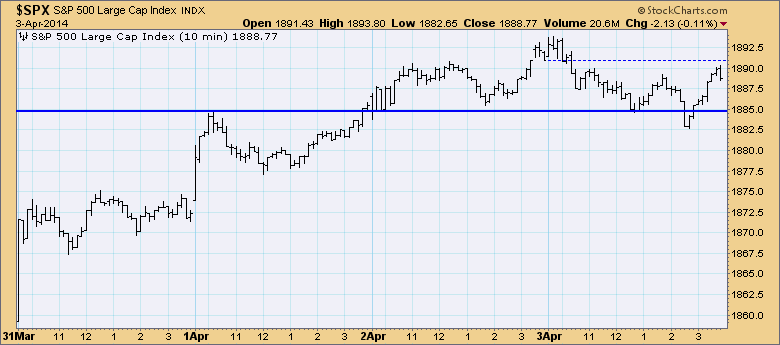
But is it enough? Looking at the market's behavior after the breakout, I have to wonder. The 10-minute bar chart gives us a different perspective of this breakout. I've drawn in the neckline/resistance around 1885. Notice how the breakout appears less than enthusiastic. Today's market action was anemic, spending most of the day consolidating sideways after the morning's weak follow-through of yesterday's breakout.
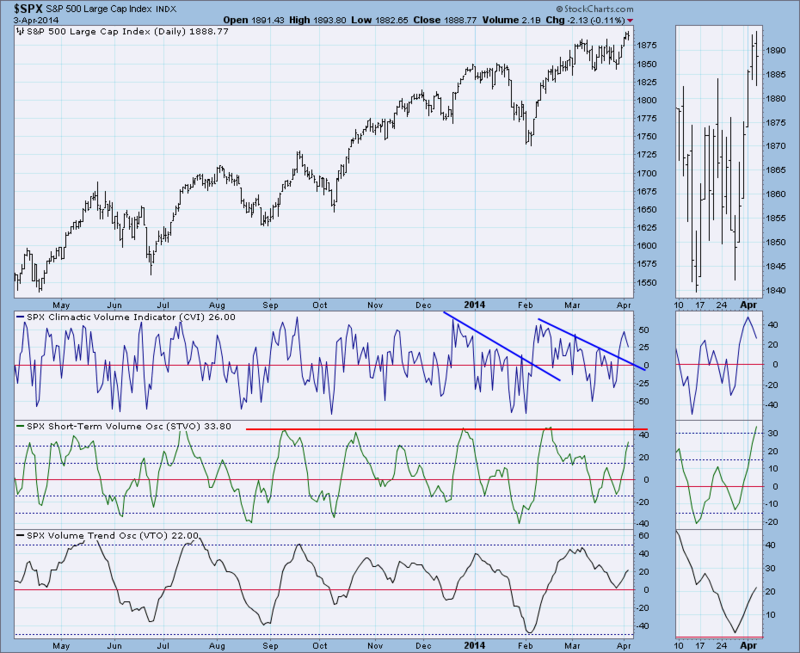
Looking at the OBV indicator suite from the DecisionPoint Market Indicator ChartPack, we can see three time frames. The CVI is the ultra-short term, the STVO is the short term and VTO is intermediate term. The CVI after breaking out has pulled back considerably over the last two days DURING the breakout. The STVO is still rising but it is already reaching extremely overbought territory and we haven't seen much of a price rise out of this breakout yet. The VTO is still rising and has room before reaching overbought, so the intermediate term still looks bullish.
I'm not saying that the breakout won't continue, I am just pointing out that recent price action following the breakout along with the shorter-term indicators, don't look that great.
Happy Charting!
Erin


