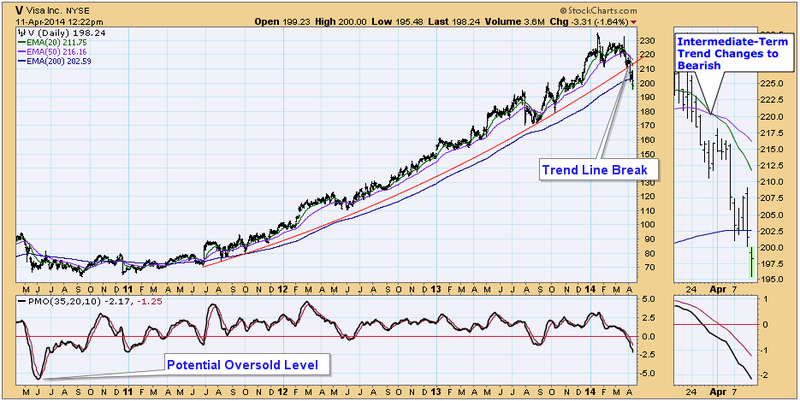
After a quick review of the charts of Dow 30 Industrial stocks, the worst looking chart, in my opinion, is that of Visa (V). The first and most obvious problem is that price has broken down through a shallow parabolic line that defines the upward trend. The second issue is that the 20EMA has crossed down through the 50EMA, which, by my definition, changes the intermediate-term trend from bullish to bearish. It isn't easy to see, but the EMA crossover actually happened before the trend line break.
The 50EMA is still above the 200EMA, so by my definition the long-term trend is still bullish.
The PMO is falling below zero (very negative), and is already at a level that equals or exceeds previous lows since 2011; however, that was during a bull market enviornment. In bearish conditions the PMO can go much lower, as demonstrated by the low in 2010. The first sign that the correction might be over would be when the PMO turns up.
My analysis here is not meant to suggest any specific action, but to point out the technical signs that can help our readers make their own specific decisions.
Happy charting,
Carl


