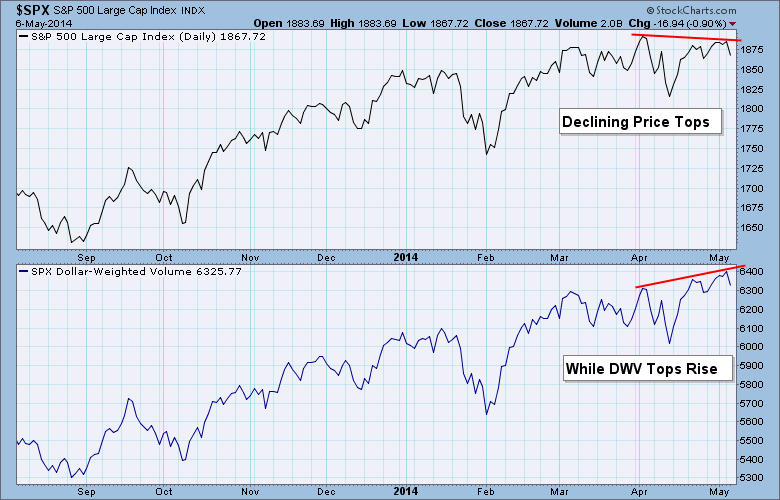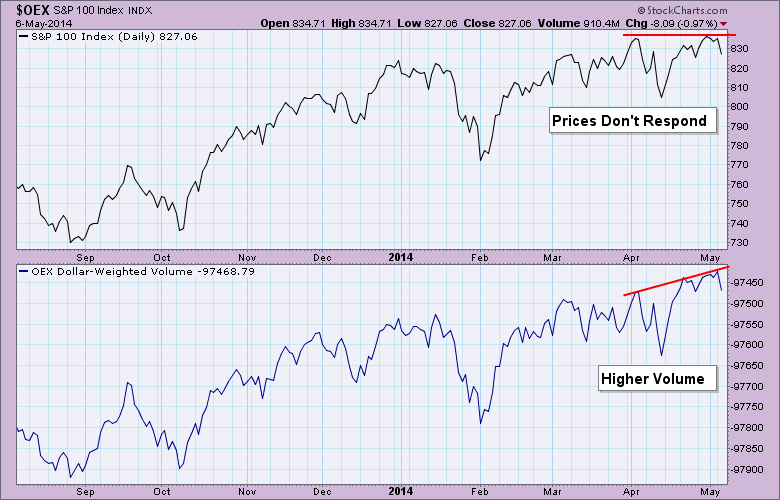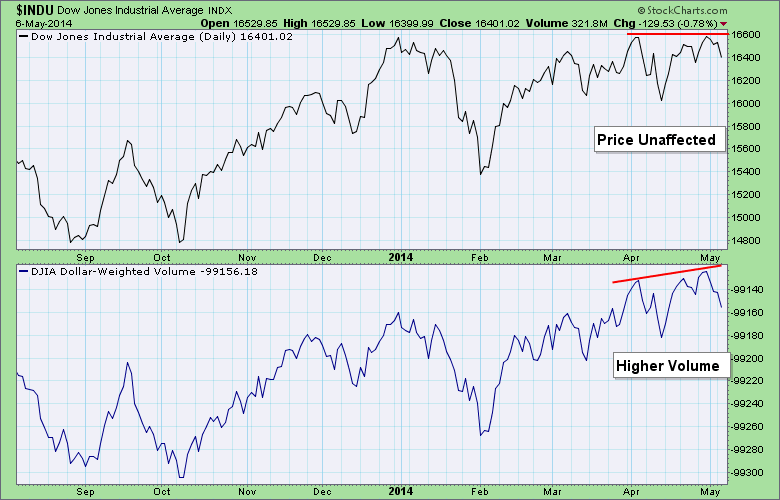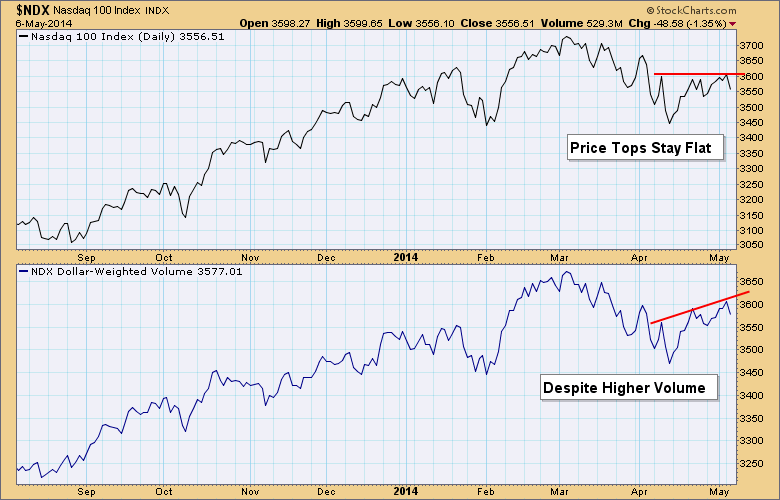
Over 10 years ago, Carl Swenlin developed an indicator called Dollar-Weighted Volume (DWV). DWV is variation of On-Balance Volume (OBV), which was developed by the late Joe Granville. DWV is calculated by multiplying the daily volume of each stock in a given market index by the closing price, then adding (or subtracting, if the stock closes down) the result to the cumulative total of DWV for the index. The resulting indicator is an expression of the trend of money rather than just volume. DWV is a short-term indicator.
We look for positive/negative divergences and for instances where volume doesn't confirm price, meaning that volume either leads or lags price. When this happens, look for a change in the short-term price trend.
Right now we have reverse divergences appearing on many of our index charts. On all of these charts we compare the flat price tops to the DWV higher tops. This represents an internal blowoff as price did not respond to the higher volume pumped in at the successive price tops, basically price could not keep pace. With so many divergences across the board, the expectation should be lower prices in the short term.
You'll find the Dollar-Weighted Volume charts in the DecisionPoint Market Indicator ChartPack (ChartList DPMI-1040) that are calculated back to 1998. For more examples on the use of DWV, you can read this blog article by Carl.
Happy Charting!
Erin


