The recent emerging weakness in small-cap stocks should alert us to potential weakness in equal weight market/sector indexes. To demonstrate this point let's look at a comparison between SPY and the S&P 500 Equal Weight Index (RSP). But wait! How do we learn about small-cap stocks by looking at a large-cap index? It is basically about comparing the largest-cap stocks to the smaller-cap stocks in the index. The last time I looked the 50 largest-cap stocks in the S&P 500 (SPX) represented about 70% of the total market capitalization of the Index. That means that the remaining 450 stocks make up only 30% of the total S&P 500 market capitalization. While those 450 stocks are still considered to be large-cap stocks, by comparison they are a lot smaller-cap than the top 50.
An equal weighted index like RSP gives an equal voice to all the components of the SPX, and that results in a significant difference in performance, and it also differs depending upon market direction. The key to deciphering this is the relative strength index at the bottom of the chart. When it rises, it shows that RSP (influenced more by the smaller-cap stocks) is stronger than SPY (the S&P 500 SPDR) and when it falls, it shows that the large-cap stocks are in the lead.
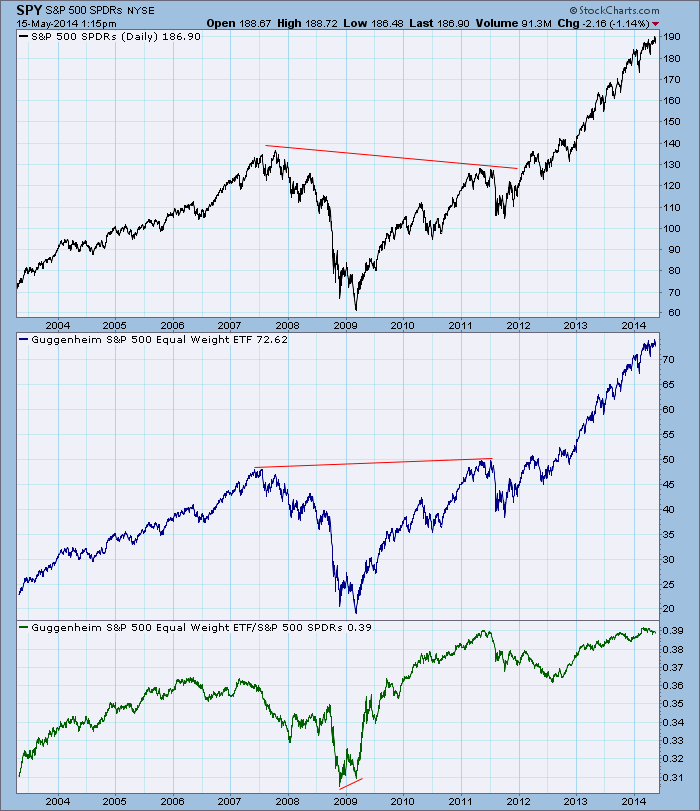
The lesson here is that RSP would be the preferred vehicle in a bull market. For example, from the 2009 price low to the recent top RSP gained 282% versus 217% for SPY. Conversely, from the 2007 top to the 2009 low RSP lost -60% versus -56% for SPY. During bear markets, RSP would probably be the candidate for short selling.
An interesting feature is the rising relative strength line during most of 2008, which only means that RSP was falling more slowly than SPY. This is an important fact to remember about relative strength. Also, the absolute level of the relative strength line is notas importat as the direction in which it is moving -- up is good, down is bad, and sideways is neutral.
Conclusion: I am a big fan of equal weight indexes because they usually perform better in bull markets than their cap-weighted counterparts; however, it is necessary to watch the relative strength line to avoid the under performance usually encountered on down legs.
May your strength be relatively great,
Carl


