A week-end look at the charts in the DP Chart Gallery tells us that the market, having just reached and pushed above horizontal resistance, is at a decision point. Will price be turned away or will it make a decisive breakout move? Let's look at what the DecisionPoint indicators tell us in the ultra-short term, short term and intermediate term. First, let's review the daily and weekly charts for the SPX. These are at the top of the DP Chart Gallery.
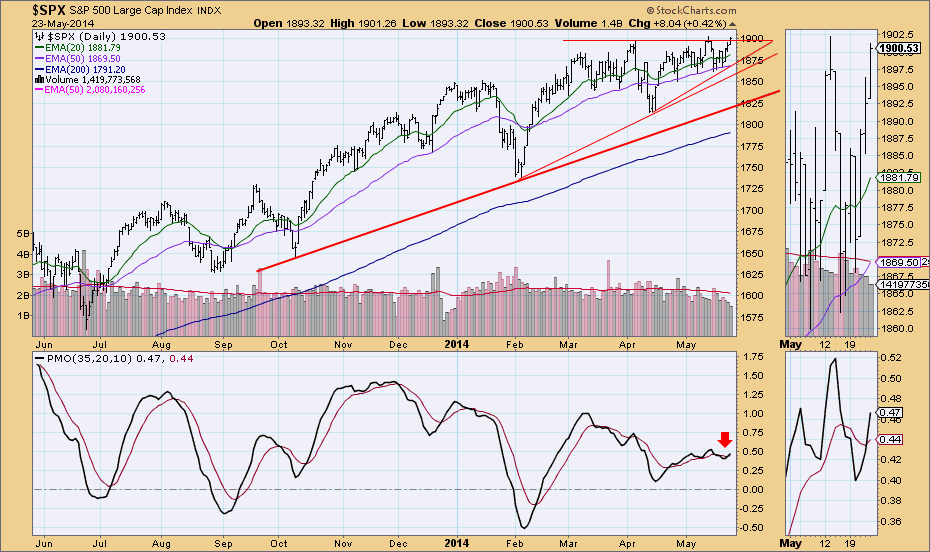
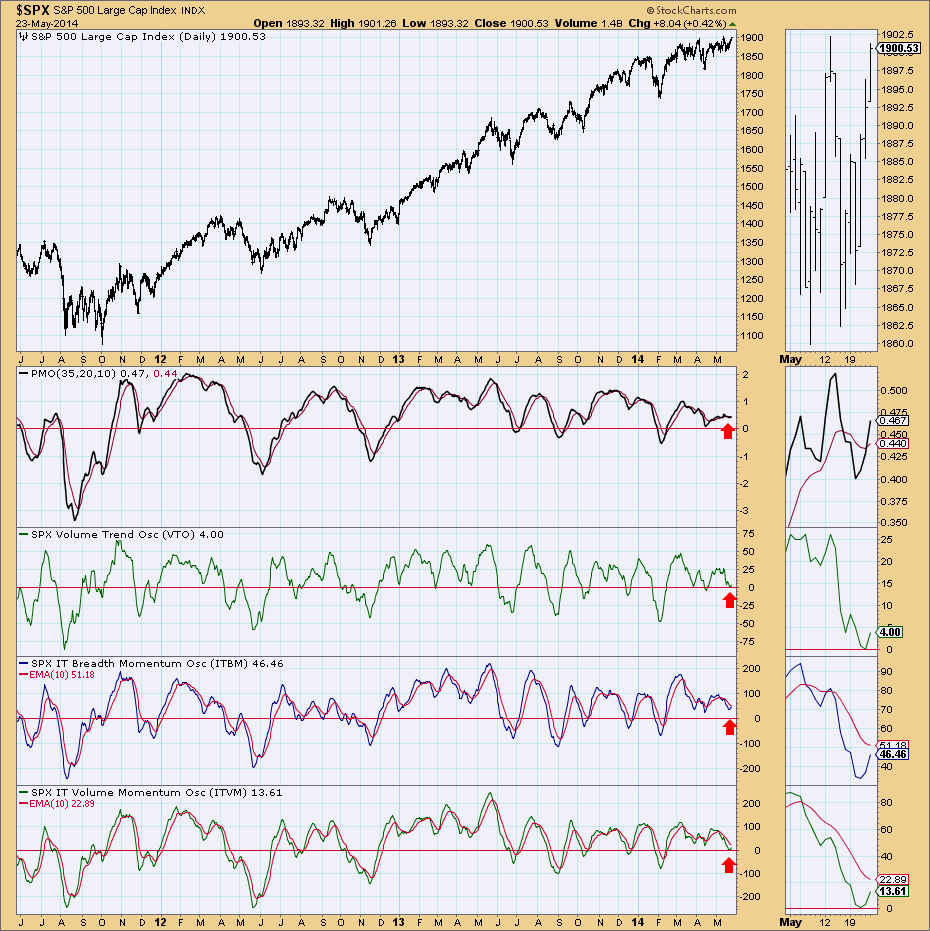
On the daily chart, we see how the market has continued to increase the slope of its ascent along support lines, but the market tops have not really increased. The PMO has had a positive crossover its 10-EMA, but as I have been noting in the DP Daily Updates, the PMO has been very "noisy", especially this last week, so we can't read too much into the crossover.
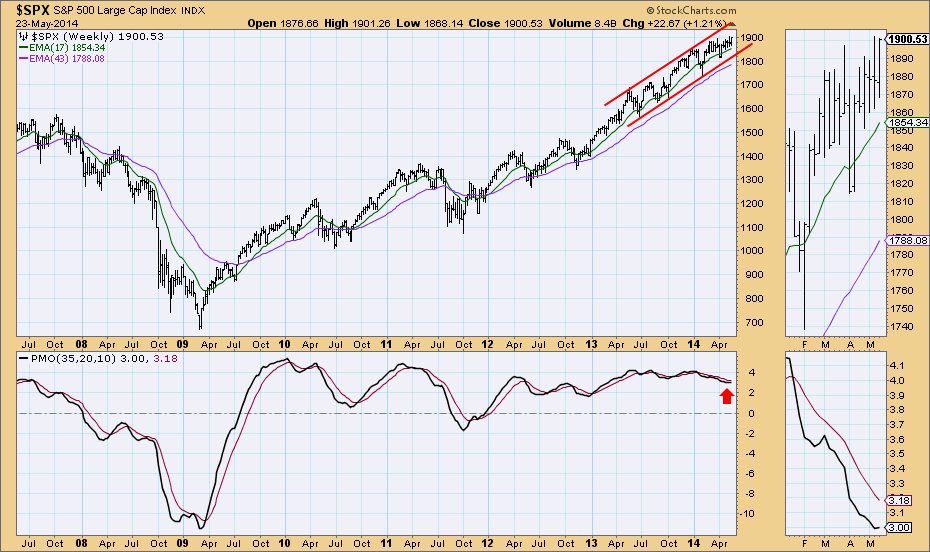
On the weekly chart, we see that price is continuing higher within a rising trend channel, but I notice that the last few weekly tops have not reached to the top of the channel, but conversely the lows haven't actually tested support either. Good news is that the weekly PMO did turn up, but we've seen this happen before over the past month and a half. The momentum shift needs to carry through longer.
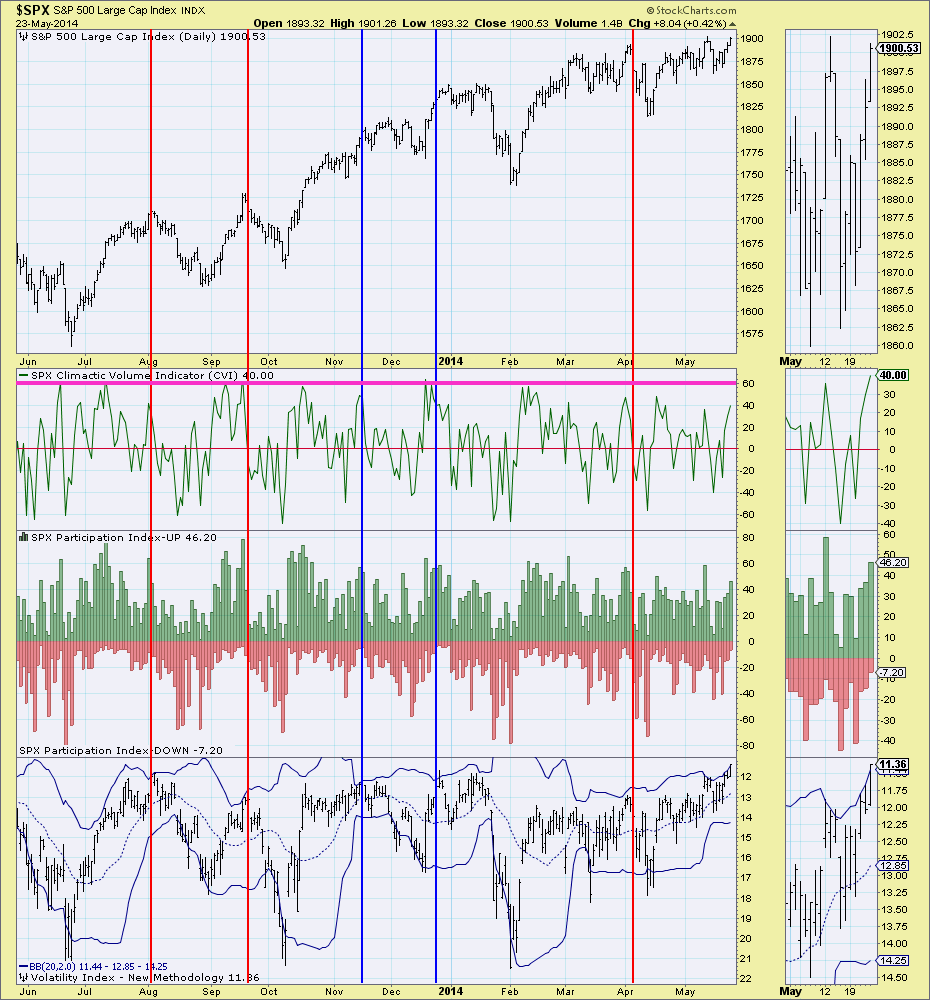
On the volatile short-term indicator chart, I annotated two different observations. First, the CVI has nearly reached the top of its range, which tells us the market is overbought in the very very short-term. The VIX readings have passed outside the top of the Bollinger Bands, when this happens, looking at the verticial annotations, it generally precedes either a short-term decline or consolidation. So ultra-short-term indicators are somewhat bearish.
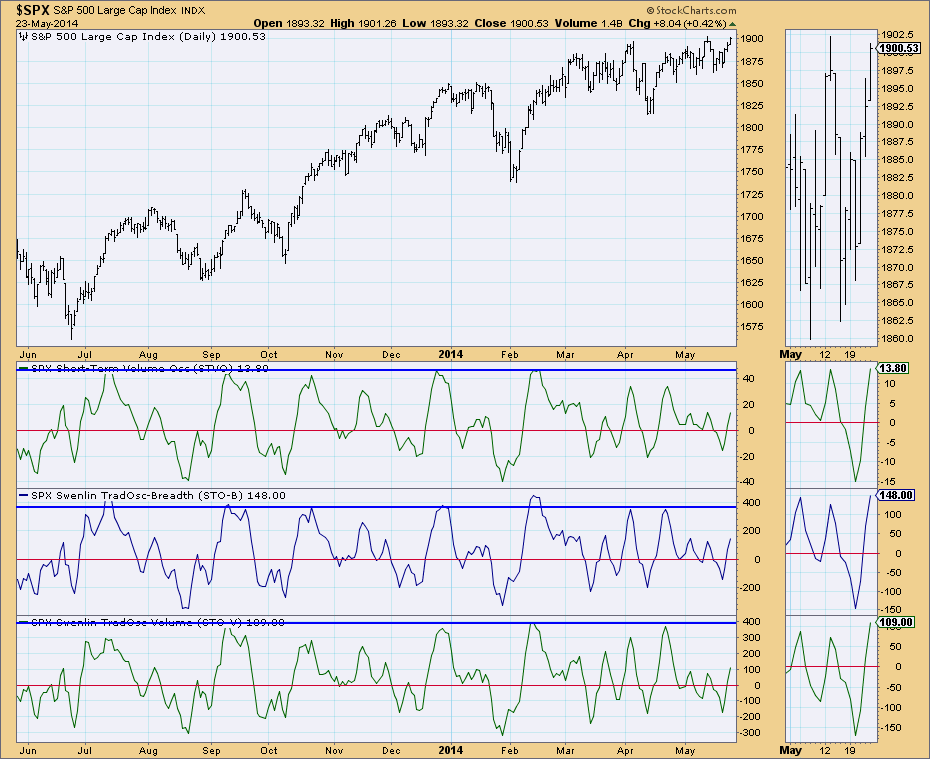
Short-term indicators are rising and have nearly passed recent tops. If we are close to an ultra-short-term or short-term top, having the STVO and STOs at the top of very recent tops, they could be considered overbought. However, we can also read this as internal price strength (rising indicators) and since readings are not at overbought extremes, it can support higher prices.
The VTO, ITBM and ITVM have all bottomed and are starting to advance higher. The ITBM and ITVM have not yet crossed their EMAs so while the bottoming of these indicators is intermediate-term bullish, I'd like to see those crossovers occur before calling the intermediate term very bullish.
In conclusion, we see ultra-short-term indicators looking somewhat bearish, short-term indicators could support either premise of a rise or a decline and intermediate-term indicators are somewhat bullish. I think the VIX readings are telling us that a decisive breakout isn't like to occur right away. With plenty of trend line support, a decline will probably be short-lived. Short-term and Intermediate-term indicators tell me that after a shallow decline, we could see that successful breakout.


