The two cornerstone indicators for DecisionPoint analysis are the PMO and the intermediate- and long-term Trend Models. The DP ETF Tracker report, found in the DecisionPoint Trackers blog, lists not only percentage changes and PMO relative strength for the select ETFs we follow, it lists the PMO BUY and SELL signals. The signal table lists how long an ETF has been on a BUY or SELL signal and whether the PMO is rising or falling and for how long. I check these reports regularly to find the new PMO BUY/SELL signal flags that give me an opportunity to analyze a particular ETF which leads to looking at related stocks or indexes associated with that ETF.
Yesterday, a PMO crossover BUY signal was generated on JJC, the copper ETF. The daily chart looks good and the weekly chart is worth noting. From there, I typed in "copper" in the 'Create a Chart: SharpChart' box and it brought up all of the stocks related to copper as well as the index itself. I found two more interesting charts to show you, $COPPER and Freeport McMoran Copper & Gold (FCX). Let's review them.
First we will look at the ETF JJC which is what caught my eye on the PMO BUY/SELL signal table from the DP ETF Tracker report. The daily chart shows the PMO crossover BUY signal, which brought me to the chart, but then I found out that it just went on an intermediate-term Trend Model BUY as well. The chart pattern looks fairly positive as well. After having broken down below the rising trend channel, it has popped back up into it. Should it rise back to the top of that channel, price could get to 40. Note also, the PMO BUY signal was available to us yesterday before market open today, so we have hindsight knowing that the signal flag would've been right on with price rising 0.84% at time of publication.
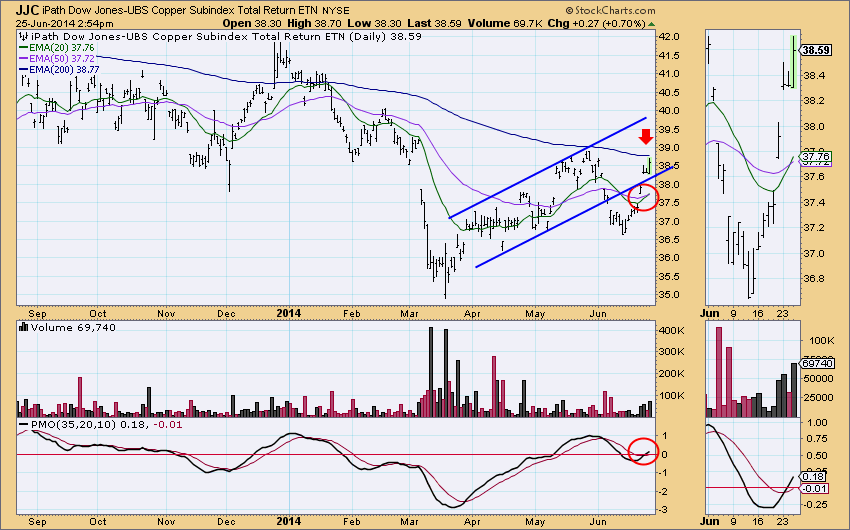
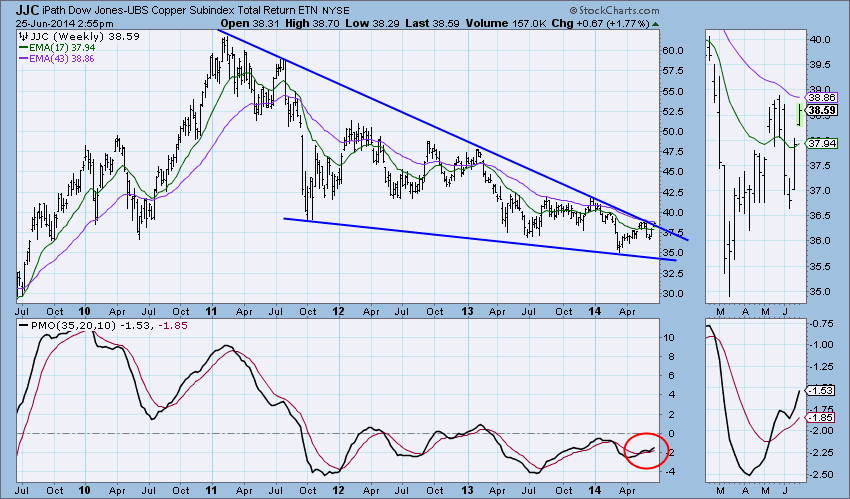
Something else I do when I get a bullish daily chart, is pull the weekly chart to see what it says. In the case of JJC, the weekly PMO just had a positive crossover and price is nearing the top of bullish descending wedge pattern. (Note: weekly charts are not "final" until after the close on Friday)

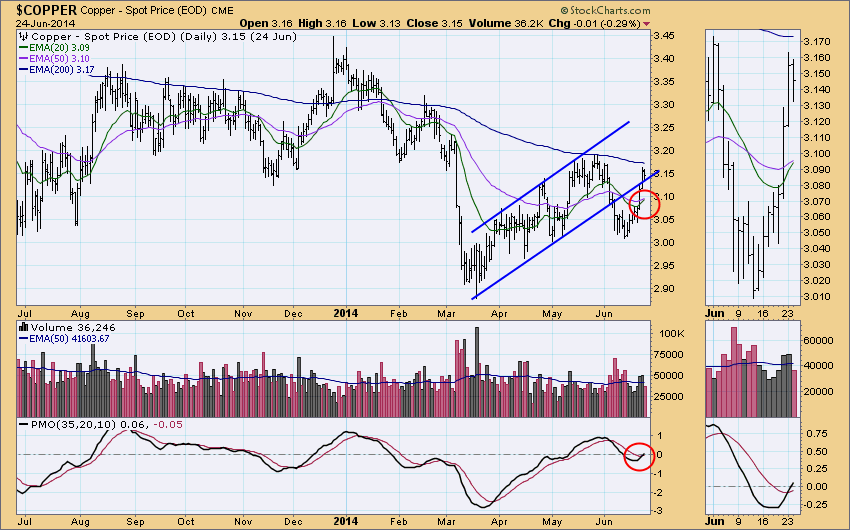
The copper spot price ($COPPER) daily chart looks very similar to JJC, but that is of course because JJC trades like copper giving investors the ability to buy into it using an ETF. There is the rising trend channel, price moving back up into and a PMO BUY signal.
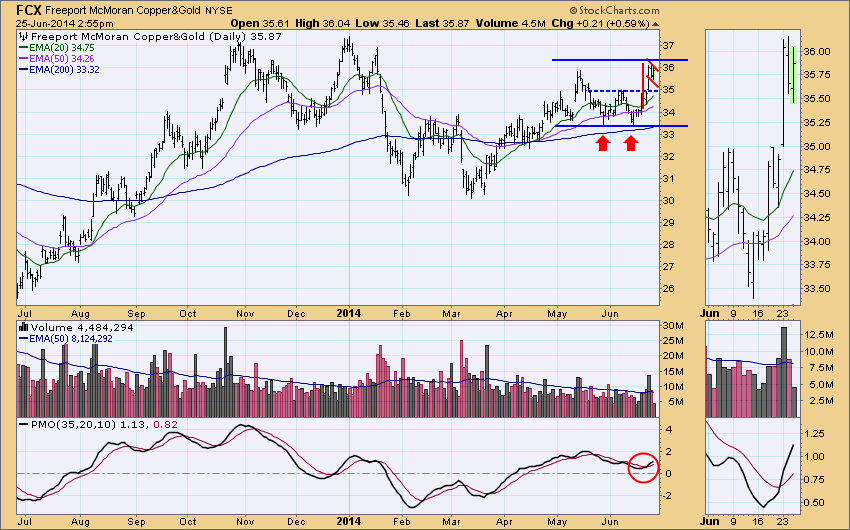
The final set of charts are for Freeport McCoran Copper & Gold (FCX). The daily chart also looks bullish as a double-bottom has executed and there looks to be a bull flag forming. There was a PMO BUY signal. The cautionary element of this chart is that it has completed the double-bottom by penetrating the neckline and reaching the minimum upside target. The EMAs are configured positively with the 20-EMA above the 50-EMA and the 50-EMA above the 200-EMA.
The weekly chart shows a breakout from the declining tops line and a recent PMO positive crossover its EMA. (Note: weekly charts are not "final" until after the close on Friday)
Conclusion: Based on my interpretation of the copper chart patterns and the PMO BUY and Trend Model BUY signals, copper could be on the rise.


