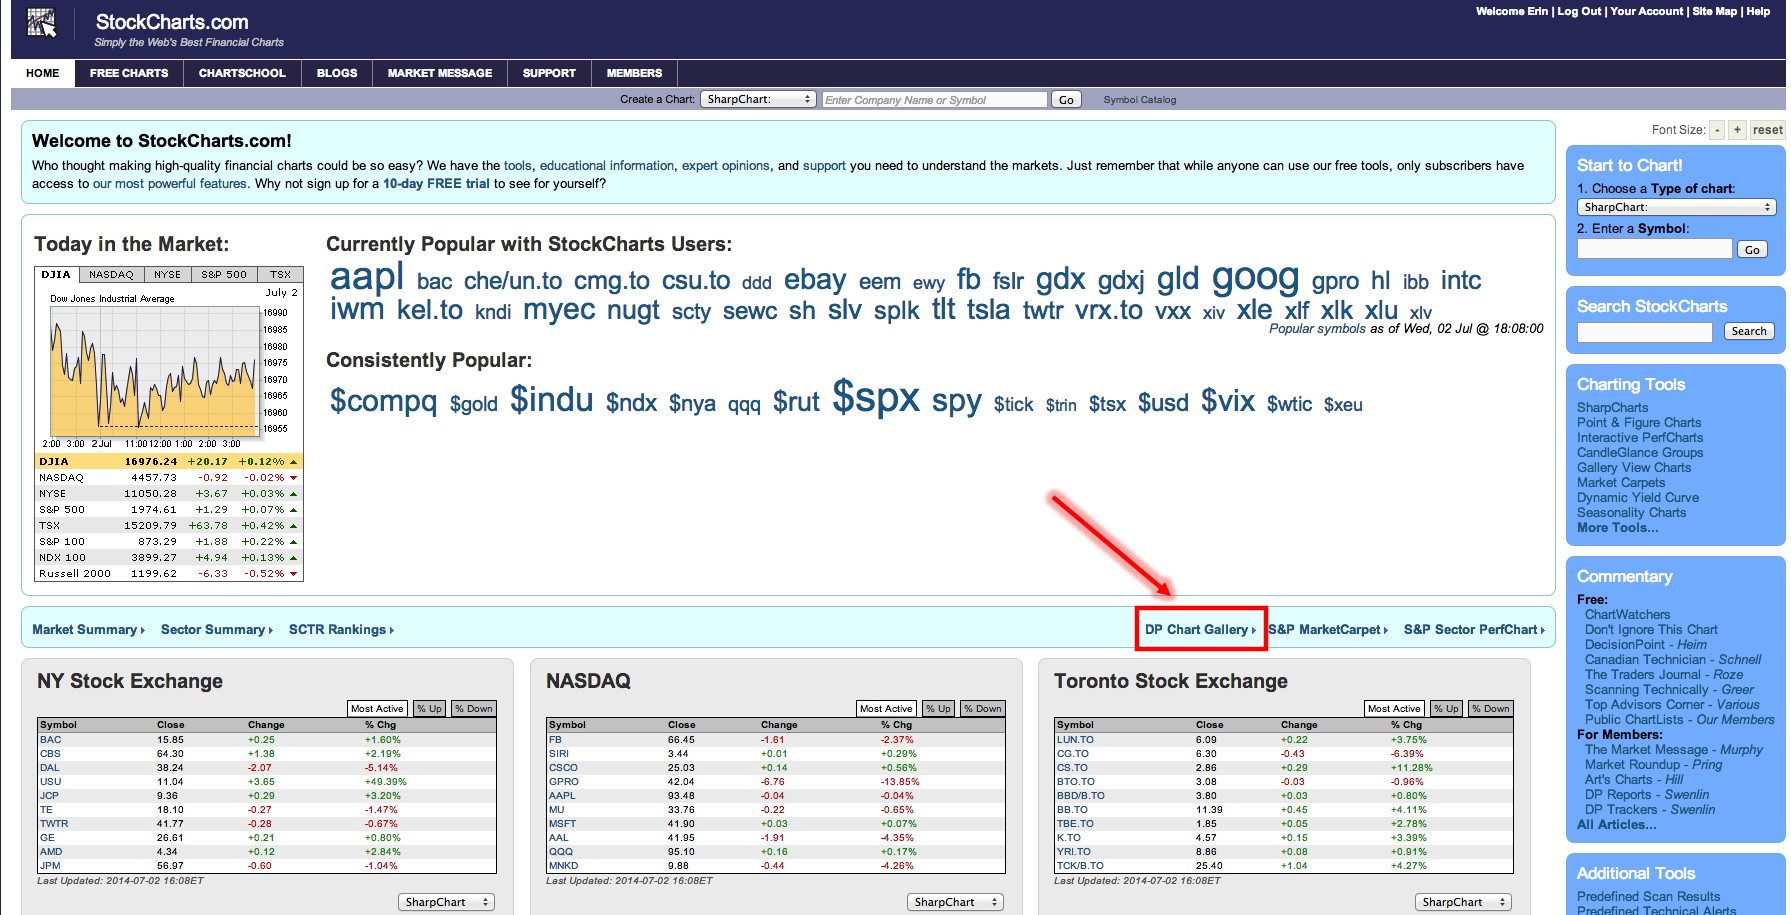
Periodically I like to do a review of the charts in the DecisionPoint Gallery, available in the 'free' area of StockCharts.com. You'll find the link to the gallery on the home page.
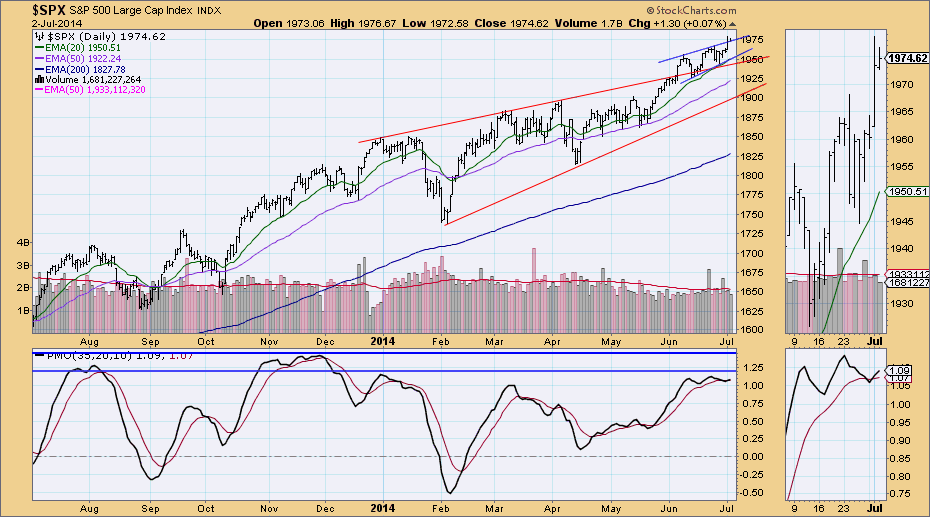
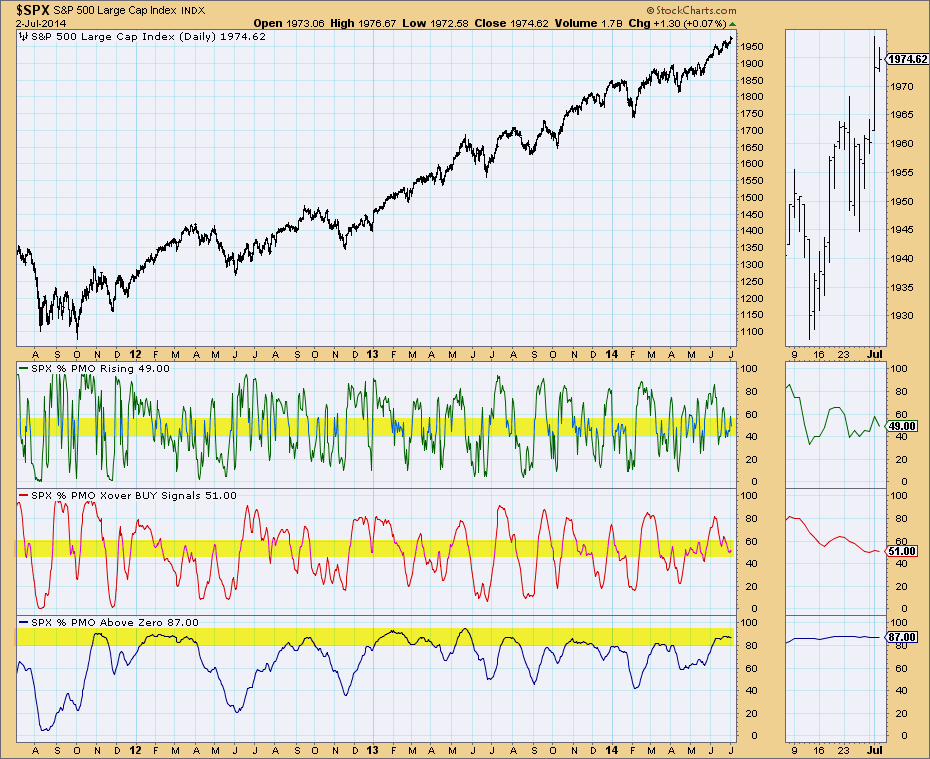
First is the $SPX daily chart. I've annotated the intermediate-term ascending wedge in red and a new short-term bear wedge in blue. With prices being so overbought, we have been expecting them to pullback and possibly correct from the intermediate-term bear wedge. No one gave investors the memo that it was time to sell, so prices have been hitting all-time highs consistently since price broke out above the wedge. The short-term ascending wedge is bearish but with the upcoming holiday weekend and shortened trading day tomorrow, I would expect to not see a decline until next week. The PMO is still overbought and has been whipsawed this week from a negative crossover PMO SELL signal to a positive crossover its EMA to generate a PMO BUY signal. There is still some headroom for the PMO to rise to overbought extremes, but not much.
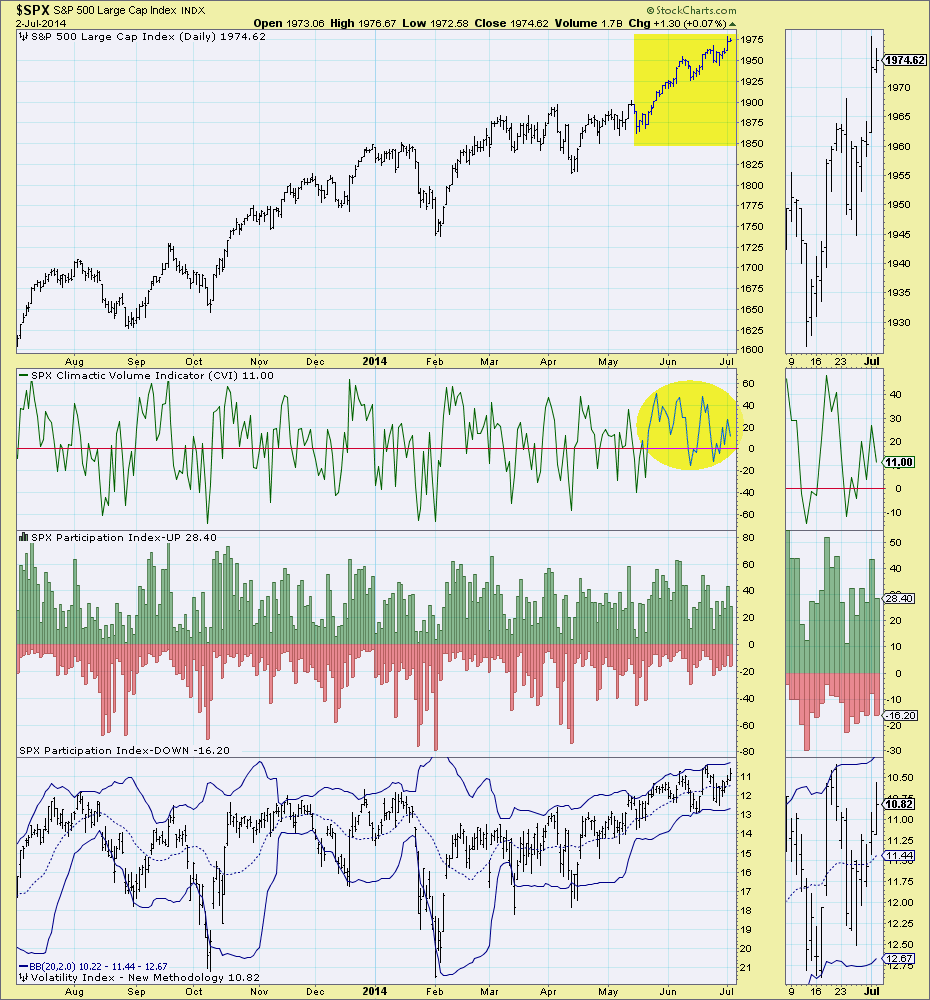
The CVI has been oscillating above the zero line which is a sign of internal strength in the very short-term.
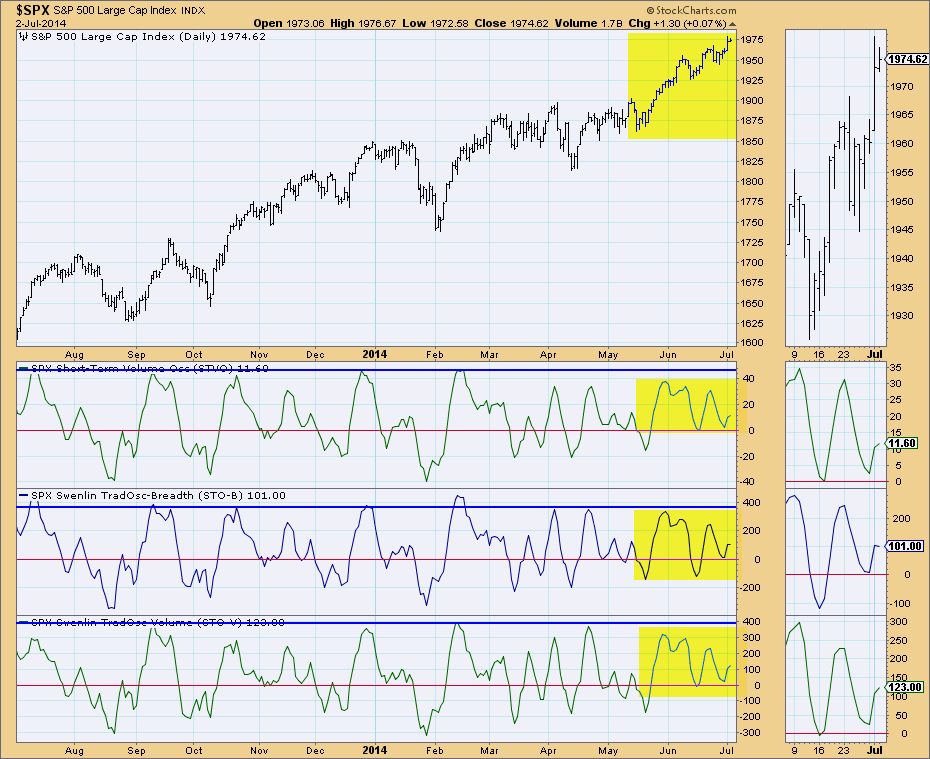
Similarly, short-term indicators have been oscillating above zero, also signifying internal strength. However, these indicators are all slowing down and in the case of the STO-B, it turned down. While this can be considered somewhat bearish, with indicators still staying above zero and having mixed readings, I view it as more neutral than bearish.
Looking at our PMO Analysis chart, we see that in the shorter term and medium term, that indicators are neutral. However, the intermediate-term % PMO above zero is overbought and needs to let off steam.
On the New Highs- New Lows chart, I've annotated the bottoms on the 10-DMA of the High-Low Differential. These bottoms generally come at price bottoms. The differential has topped, but it will hesitate now and then. I find that bottoms on this indicator are more reliable than tops.
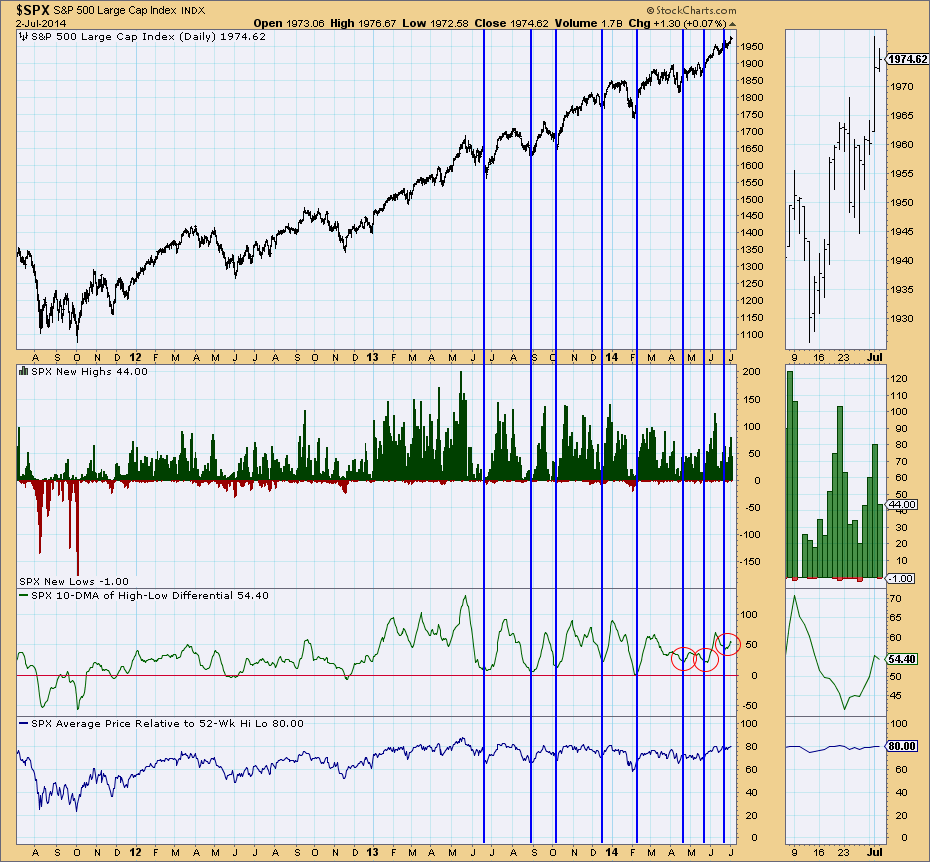
In conclusion, shorter term, the market is still showing internal strength. Intermediate-term indicators are bearish in that they are so overbought. However, with the PMO generating a BUY signal and the 10-DMA High-Low Differential bottom, there is room for more rally. The short-term ascending wedge could come into play next week when investors are back from the holiday weekend.


