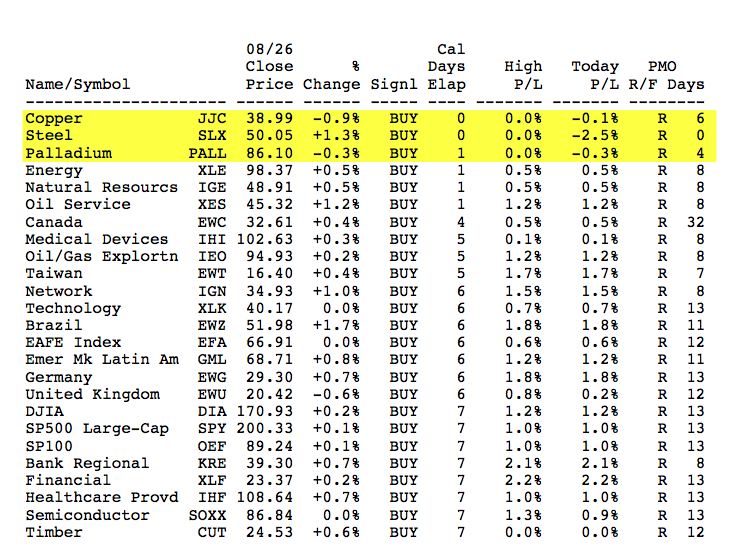
Looking at today's DecisionPoint ETF Tracker, I noticed three new PMO BUY signals on Copper (JJC), Steel (SLX) and Palladium (PALL). Gold (GLD) and Silver (SLV) are still suffering and haven't joined the party. Below is a cross-section of the DP ETF Tracker report where I found today's PMO BUY signals. You'll find it in the fourth spreadsheet of the report. The columns of the report tell us the signal, how many days it has been in effect, the profit/loss of the signal and the days the PMO has been rising, "R" or falling, "F".
Let's review the charts, as we never want to take a PMO BUY/SELL signal at face value.
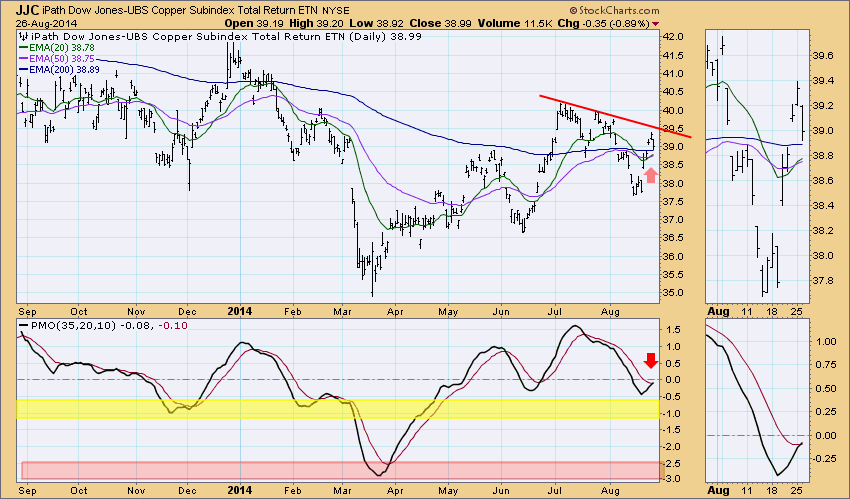
First is Copper. JJC recently tested resistance and failed to break out. However, although it lost almost .09% today, momentum is still positive (PMO is rising). I like that the 20-EMA had a positive crossover the 50-EMA generating a Trend Model BUY signal, but I don't like that it came only days after a Trend Model SELL signal (20-EMA moved below the 50-EMA). The PMO bottomed in somewhat oversold territory (shaded in yellow), certainly not at its extremes (shaded in red). The PMO will hopefully have a clean crossover, meaning we won't see any hesitation, twitching or further crossovers until it gets overbought. When signals get whipsawed from multiple short-term crossovers, they are generally less reliable.
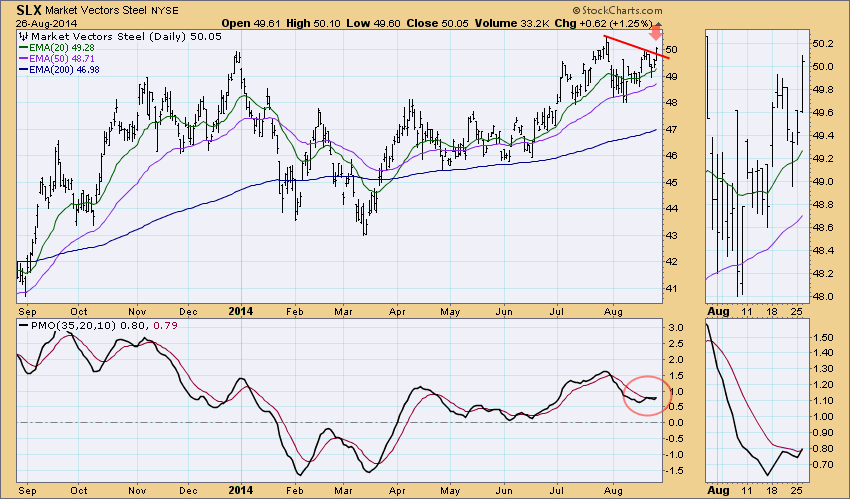
Steel looks good. It broke above resistance today and the EMAs are configured very positively with the 20-EMA spaced above the 50-EMA, which has plenty of space between it and the 200-EMA. I would like to see the PMO bottom in more oversold territory and minus the recent twitching before the crossover.
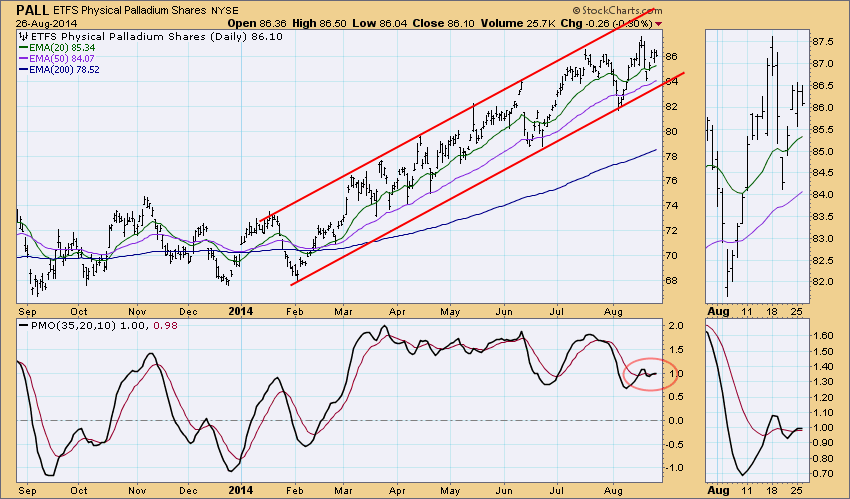
Palladium's PMO BUY signal actually occurred yesterday. It's traveling in a nice rising trend channel. Price is in the middle of the channel. It would be nicer if it had just bounced off of support. Price also failed to make the top of the rising trend channel before turning down. The 20/50/200-EMAs are configured very positively but the PMO has been whipsawed as of late, making us tentative about the veracity of this recent crossover BUY signal.
Conclusion: There are certainly positive configurations on all three metals' charts, but there are also negatives that should play into your investment and risk management strategies. Remember, the PMO generates BUY or SELL Signals when it crosses up or down through its 10-DMA. These signals tend to be short-term in duration, but they can last for several weeks. Do not take them at face value because they can whipsaw quite a bit, a good example would be Palladium's PMO. They should be used to alert you to possible trading opportunities not used as a mechanical trading model. Always check our daily stock charts to verify the price pattern and the configuration of the PMO.
Happy Charting!
Erin


