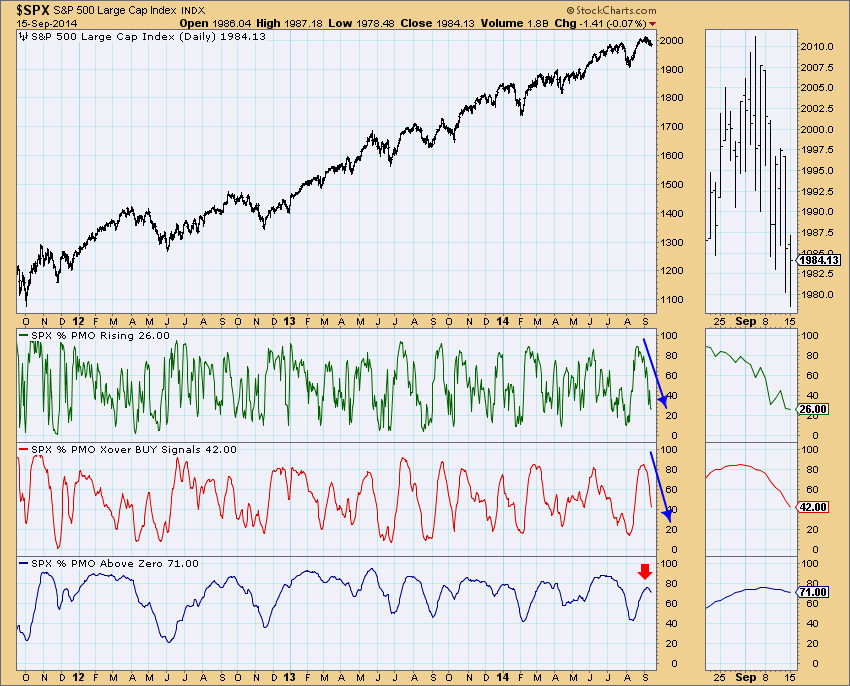
The free DecisionPoint Chart Gallery is a hidden gem with the link sitting in the middle of the StockCharts Homepage. You may want to review it daily (if you don't already!). The S&P 500 charts are free to view, but as a member you can also see the same gallery of charts for the DOW, OEX and NDX. It's been some time since I did a general review of some of the charts there. I believe there are some charts you will want to see. Indicators are bearish in all three time frames, internal weakness is visible and we have a PMO SELL signal that generated last week.
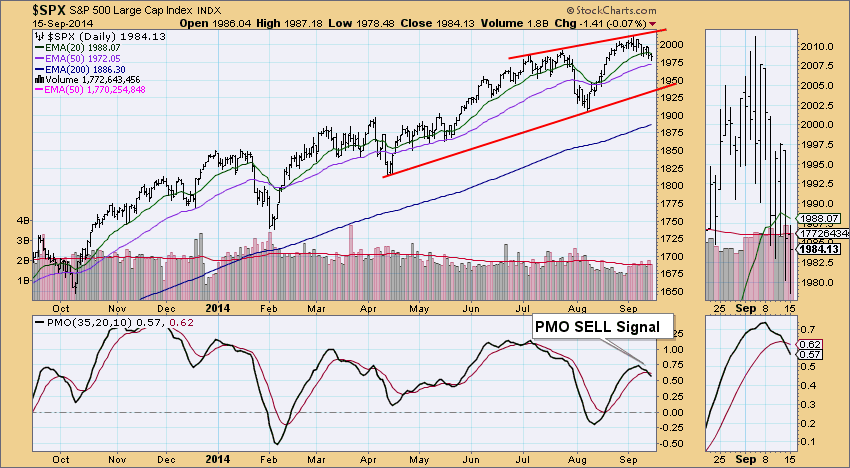
The daily chart for the SPX shows the dominant chart pattern is an ascending wedge. The rising wedge is a bearish formation of which the expectation is a breakdown. The other negative, a Price Momentum Oscillator (PMO) SELL signal was generated when the PMO crossed below its EMA. Price has formed a rounded top and traded below the 20-EMA.
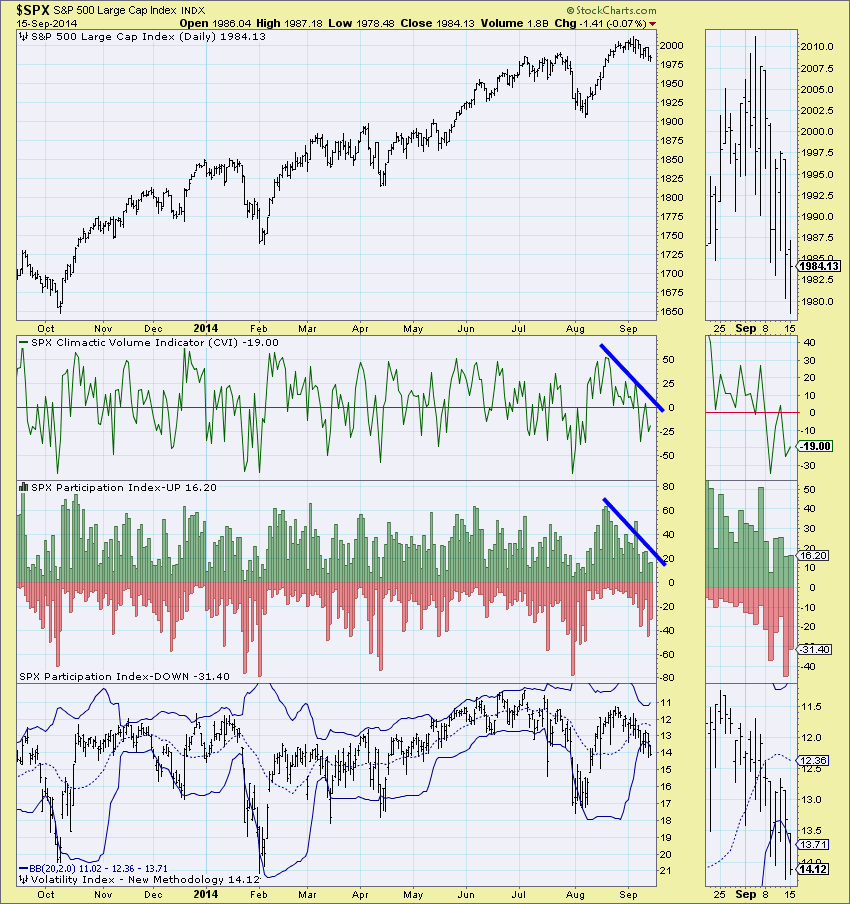
Ultra-short-term indicators have been trending lower since before the price top. This is indicative of internal weakness.
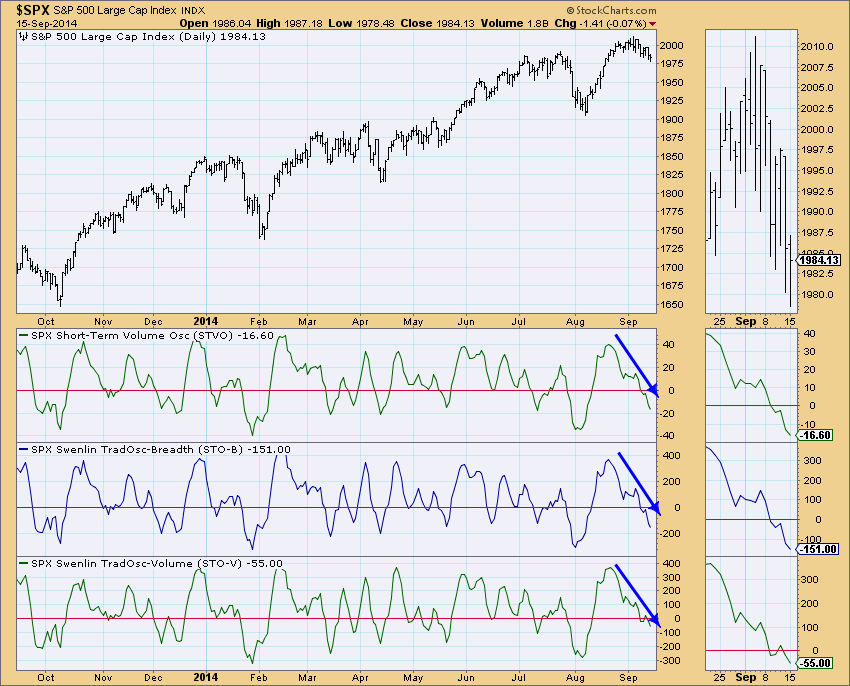
Short-term indicators were looking indecisive, but they are now declining quickly. They still have more distance to travel before hitting extremely oversold territory.
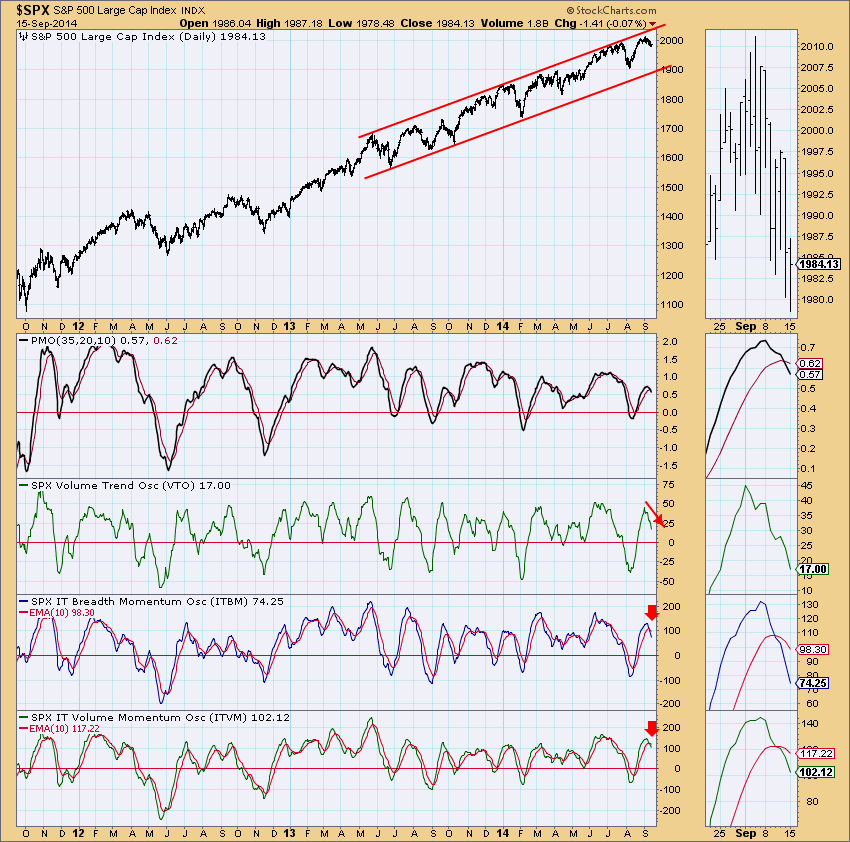
In the intermediate term, the ITBM and ITVM have had negative crossovers their EMAs which is very bearish. The VTO is also declining. These indicators are not even in neutral territory and therefore, have plenty of open space to move down through if the market continues to decline.
Finally, take a look at the PMO Analysis chart. Each panel represents a different time frame with the top being short term, middle being medium term and third being longer term. Not only are we seeing very deliberate drops in the readings for the short and medium terms, but note that in the longer term, the % PMO Above Zero topped before hitting the top of its range.
Indicators in all time frames are quite bearish. There is fear regarding the possible outcomes of the FOMC policy meeting that should keep things in a holding pattern for at least another day. After that, it's anyone's guess as to how the market will react to any news, whether it is technically positive or negative. This instability is the not the best foundation for a renewed rally, instead it could be the excuse the market needs to start a correction.
If you like this type of analysis and commentary of the DecisionPoint market indicators, I recommend you subscribe to the DP Daily Update that is part of the "DP Reports" blog. I look at similar charts and analyze them every market day for continuity. The commentary is brief and it is not a chart overload. In addition to the S&P 500, I review the dollar, gold, oil and bonds each day as well. Remember that you must be a StockCharts member in order to read the "DP Reports" blog.
Happy Charting!
Erin

