 For those of you who don't know, I publish a DP Daily Update in the DP Reports blog. Everyday I analyze the same charts to give you continuity and the opportunity to truly understand our premier market indicators. Along with the S&P 500, I review 'the big four': the dollar, gold, oil and bonds. It is a concise review that takes only a few minutes to read. So on Wednesday's, I will publish the "DP Weekly Update". If you like it, you can access the "DP Daily Update" in the DP Reports blog which is available to StockCharts members. If you haven't already, sign up for email notifications so you'll know when the DP Weekly Update is published, along with all the other fascinating articles I write. You can also subscribe to the DP Reports blog to be notified when the DP Daily Update is published. Enjoy!
DP Weekly Update: Last Minute Save - October 29, 2014
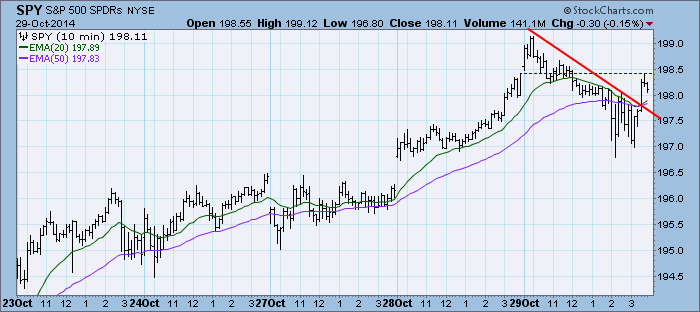
The market started higher but then made a steady decline supposedly on news out of the Fed that they will be ending quantitative easing. Most analysts, myself included, don't see that as an issue for today's trading because it isn't 'new' news. More likely price was overextended and needed a decline. What was interesting was the pop at the end of the day that helped cover today's losses.
The purpose of the DecisionPoint Daily Update is to quickly review the day's action, internal condition, and Trend Model status of the broad market (S&P 500), the nine SPDR Sectors, the U.S. Dollar, Gold, Crude Oil, and Bonds. To ensure that using this daily reference will be quick and painless, we are as brief as possible, and often we let a chart speak for itself.
SIGNALS: Here we include the current day's signal table, an excerpt from the DecisionPoint Alert Daily Report.
DECISIONPOINT ALERT DAILY REPORT
Wednesday, 10/29/2014

************************ DECISIONPOINT MARKET POSTURE ***********************

The following is the market posture suggested by our mechanical trend-
following tools. These are not trading recommendations, rather they are price
activity flags that should be qualified by chart analysis. The Trend Model is
used on all indexes.


                                     Days   Index     10/29   Points  Percent
Index               Posture     Date Elap  @Start     Close      P/L      P/L
------------------- ------- -------- ---- -------   -------  -------  -------
Stocks Medium-Term  Neutral 10/09/14   20   192.74   198.11     ....     ....
Stocks Long-Term    Neutral 10/09/14   20   192.74   198.11     ....     ....
Gold (NY Spot)      Bearish 08/21/14   69  1275.40  1224.90   +50.50    +4.0%
20+Yr T-Bond  (TLT) Bullish 01/17/14  285   103.13   119.46   +16.33   +15.8%
------------------- ------- -------- ---- -------   -------  -------  -------
Dollar Index  (UUP) Bullish 07/21/14  100    21.47    22.85    +1.38    +6.4%
Commodities   (GSG) Neutral 07/14/14  107    32.64    28.12     ....     ....
Crude Oil     (USO) Neutral 07/30/14   91    36.92    31.23     ....     ....
------------------- ------- -------- ---- -------   -------  -------  -------
S&P 500       (SPY) Neutral 10/09/14   20   192.74   198.11     ....     ....
S&P Equal Wt  (RSP) Neutral 10/02/14   27    74.86    76.59     ....     ....
Dow           (DIA) Neutral 10/13/14   16   162.79   169.40     ....     ....
Nasdaq 100    (QQQ)     BUY 10/29/14    0    99.81    99.81 * Changed Today *
NDX Equal Wt (QQEW) Neutral 10/10/14   19    37.91    40.39     ....     ....
S&P 100       (OEF) Neutral 10/13/14   16    84.23    88.26     ....     ....
S&P 400 MidCp (IJH) Neutral 09/29/14   30   137.67   139.57     ....     ....
S&P 600 SmlCp (IJR) Neutral 09/23/14   36   105.68   108.99     ....     ....
Total Market  (VTI) Neutral 10/07/14   22    99.32   102.17     ....     ....
Consumer Disc (XLY) Neutral 10/03/14   26    66.95    67.00     ....     ....
Cons Disc EWt (RCD) Neutral 10/02/14   27    79.64    81.35     ....     ....
Consumer Stpl (XLP)     BUY 08/20/14   70    44.59    46.12    +1.53    +3.4%
Cons Stpl EWt (RHS)     BUY 10/21/14    8    98.15    99.48    +1.33    +1.4%
Energy        (XLE) Neutral 09/08/14   51    95.08    85.99     ....     ....
Energy EWt    (RYE) Neutral 09/08/14   51    87.04    75.98     ....     ....
Financial     (XLF)     BUY 10/29/14    0    23.44    23.44 * Changed Today *
Financial EWt (RYF) Neutral 10/09/14   20    40.93    42.48     ....     ....
Health Care   (XLV)     BUY 10/23/14    6    64.31    65.79    +1.48    +2.3%
Health Cr EWt (RYH)     BUY 05/09/14  173   115.95   134.63   +18.68   +16.1%
Industrial    (XLI) Neutral 10/01/14   28    52.15    54.45     ....     ....
Industrl EWt  (RGI) Neutral 10/01/14   28    83.53    86.70     ....     ....
Materials     (XLB) Neutral 10/06/14   23    48.43    47.15     ....     ....
Materials EWt (RTM) Neutral 10/02/14   27    81.60    80.44     ....     ....
Technology    (XLK) Neutral 10/13/14   16    37.63    39.79     ....     ....
Technolgy EWt (RYT) Neutral 10/07/14   22    82.39    84.67     ....     ....
Utilities     (XLU)     BUY 08/28/14   62    42.62    44.48    +1.86    +4.4%
Utilities EWt (RYU)     BUY 08/20/14   70    71.92    75.19    +3.27    +4.5%

Average                                33                               +5.4%
You will start seeing the DP Daily Alert Report table begin to flip back to BUY signals as prices seem to have recovered from the correction.
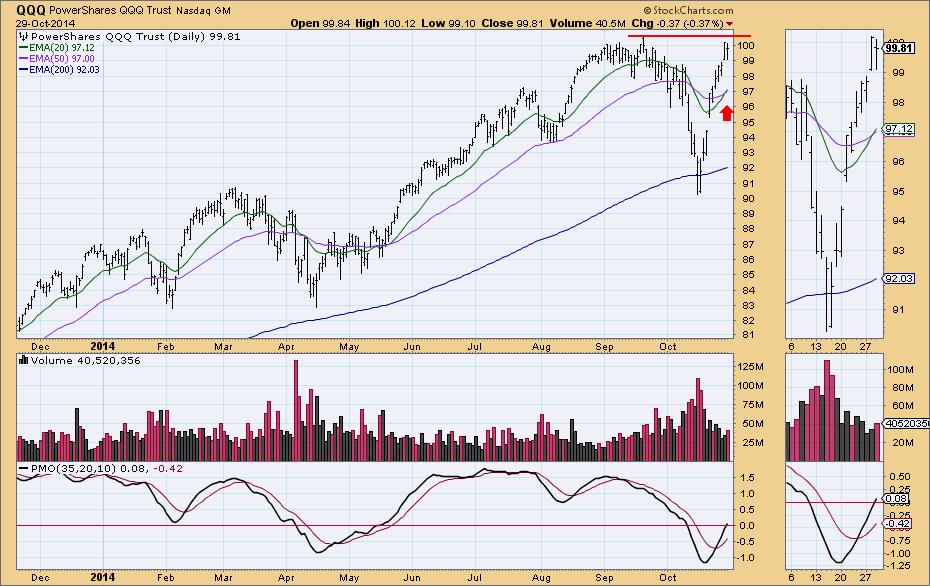
The NDX ETF (QQQ) switched back from a Trend Model Neutral signal to a BUY signal as the 20-EMA crossed back above the 50-EMA. Note on this chart that price is very close to all-time highs and the PMO had a positive crossover in oversold territory last week.
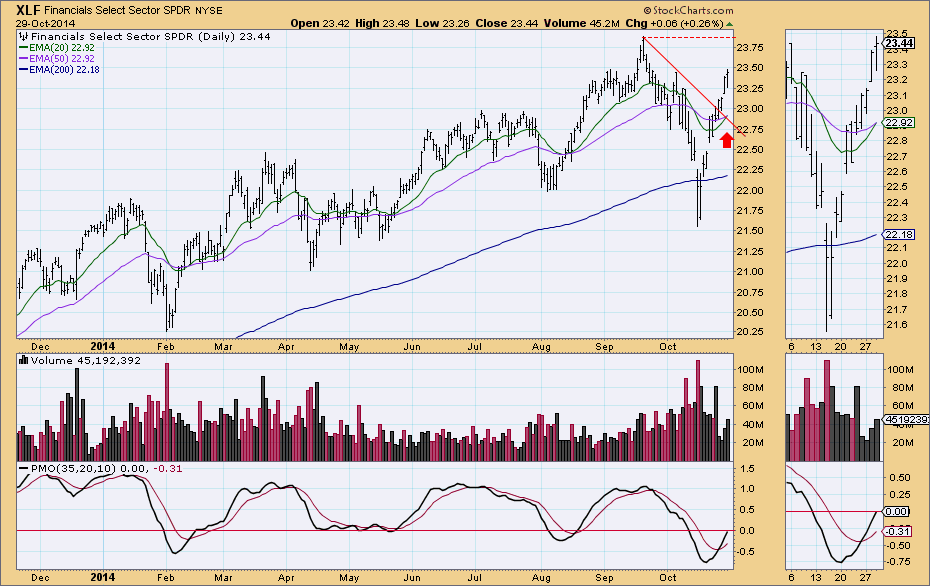
The next switch from a Trend Model Neutral signal to a BUY signal is the cap-weighted Financial ETF (XLF). After breaking out, price continues higher reaching for the September high. Like the QQQ above, the PMO had a positive crossover after bottoming in oversold territory which is bullish.
NOTE: Mechanical trading model signals define the implied bias of the price index based upon moving average relationships, but they do not necessarily call for a specific action. They are information flags that should prompt chart review. Further, they do not call for continuous buying or selling during the life of the signal. For example, a BUY signal will probably return the best results if action is taken soon after the signal is generated. Additional opportunities for buying may be found as price zigzags higher, but the trader must look for optimum entry points. Conversely, exit points to preserve gains (or minimize losses) may be evident before the model mechanically closes the signal.
STOCKS: Based upon a 10/9/2014 Trend Model NEUTRAL signal, our current intermediate-term market posture for the S&P 500 (SPY) is neutral. The Trend Model, which informs our long-term outlook, is on a Neutral signal as of 10/9/2014 so our long-term posture is neutral.
I've annotated a rising bottoms trend line starting at the April bottom because you can see how price has stayed right on top of it since the breakout. So while today was a negative day, support is holding along that trend line. The 20-EMA is getting close to a crossover the 50-EMA which will move us from a Trend Model Neutral to a BUY again.
Ultra-Short-Term Indicators: After yesterday's climactic readings, today's are simply normal.
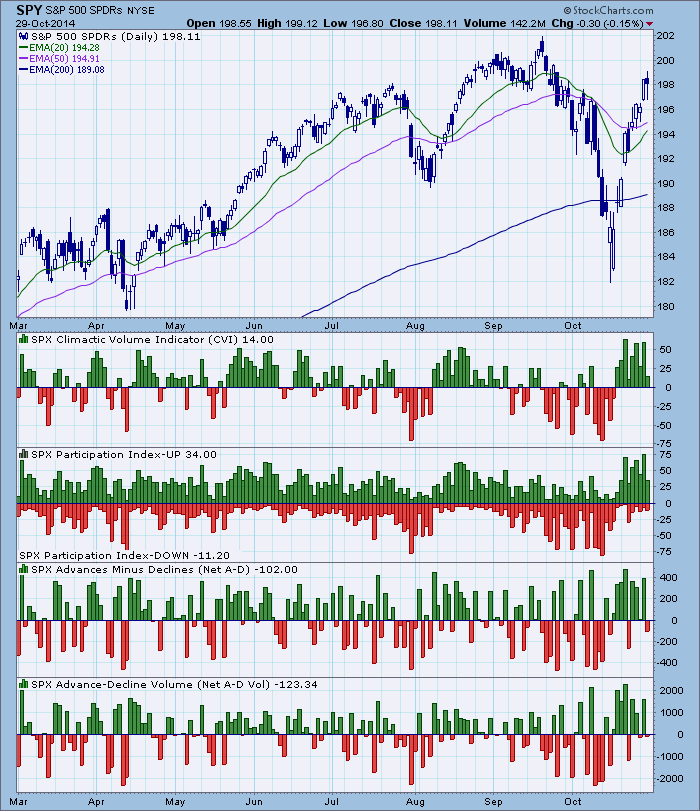
Short-Term Indicators: All of these indicators bottomed which is bullish. The only concern would be that they are all very overbought. This doesn't mean this is bearish, it means that indicators will need to eventually relieve this pressure. That doesn't have to be accomplished with a decline, a consolidation will work too. As I noted yesterday, oscillators by their very nature must oscillate. If they get too overextended, they will find a way to move lower any way they can. This can happen even with positive market action. Good news is that right now there is room for these readings to get higher still.
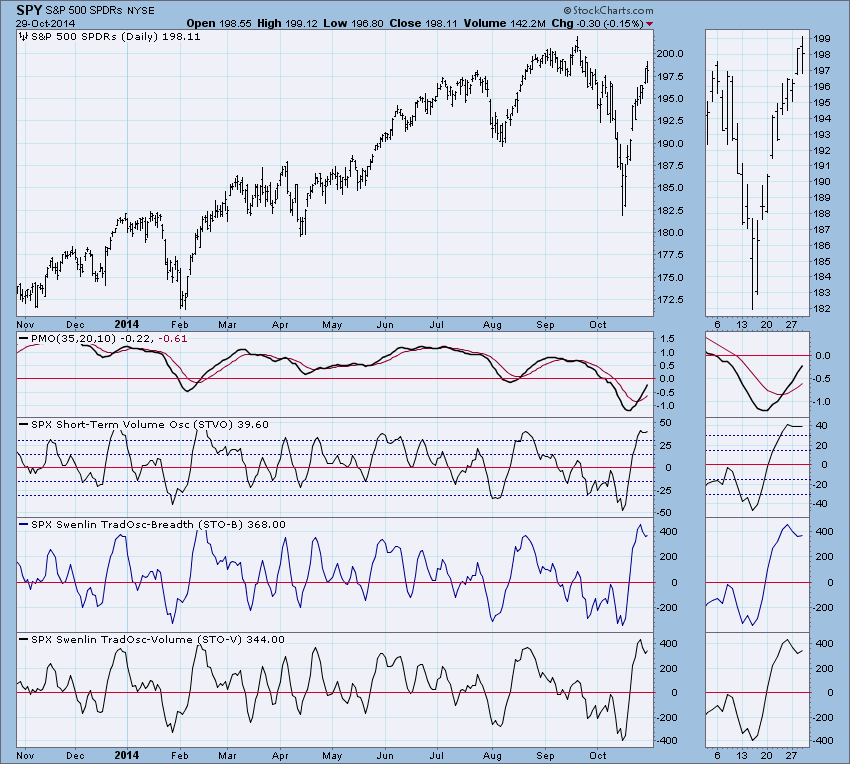
Intermediate-Term Indicators: Readings continue to rise and have reached neutral territory just above the zero line. The VTO is bordering on overbought territory, but there is headroom to move higher.
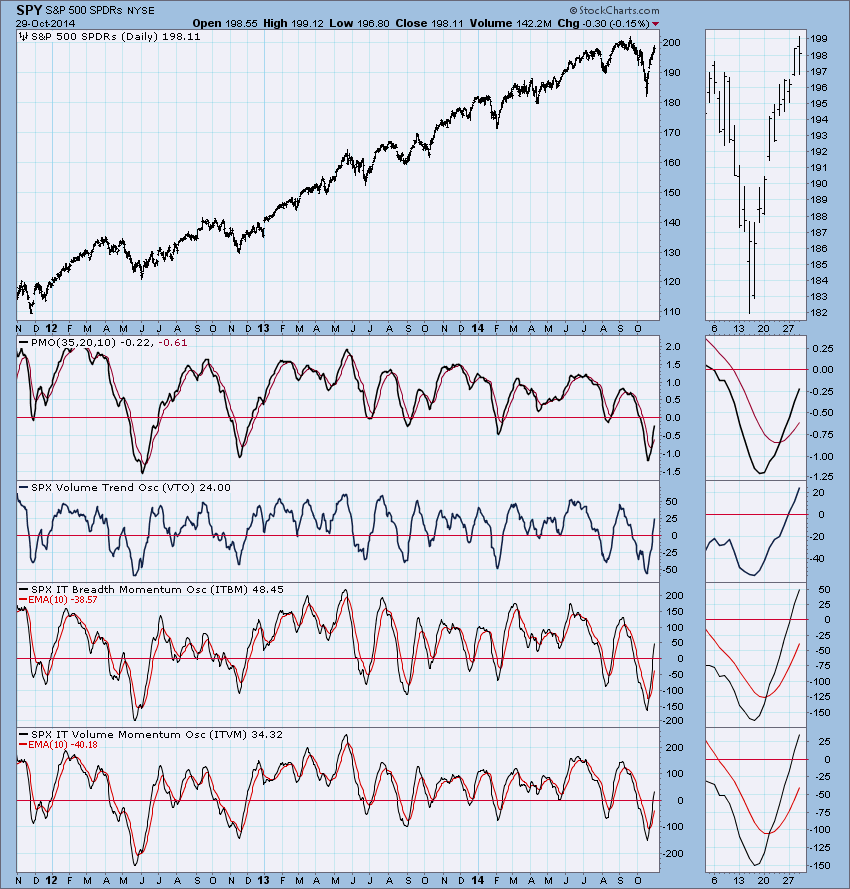
Conclusion: Indicators in all time frames are bullish. If you're looking for something to worry about, the readings on short-term indicators are very overbought and could signal a pause or even decline in the short term. Price is staying above support and today's last minute rally might be a sign that higher prices will follow tomorrow.
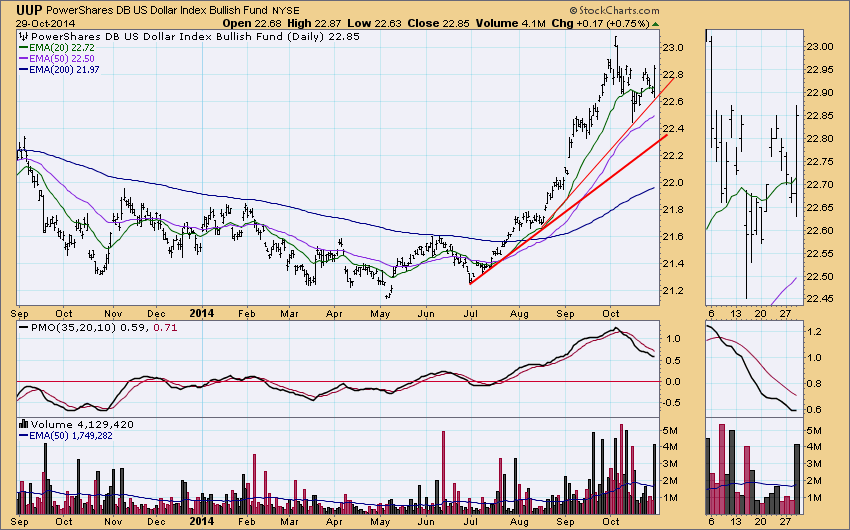
DOLLAR: As of 7/21/2014 the US Dollar Index ETF (UUP) is on a Trend Model BUY signal. The LT Trend Model, which informs our long-term outlook, is on a BUY signal as of 8/21/2014, so our long-term posture is bullish.
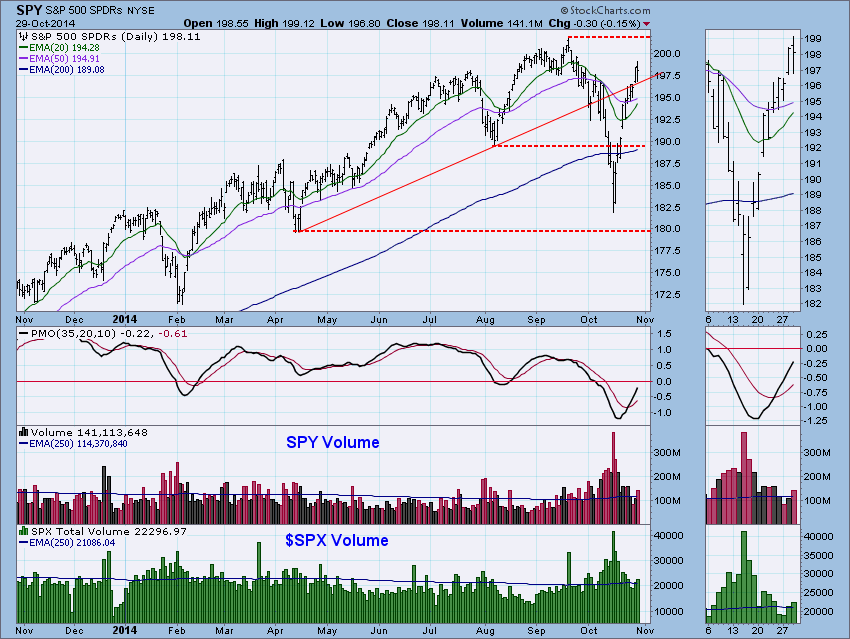
Price bounced right off of support along the shorter-term rising bottoms line. The PMO turned slightly up which is also bullish. The next area of resistance will be at the high posted earlier this month.
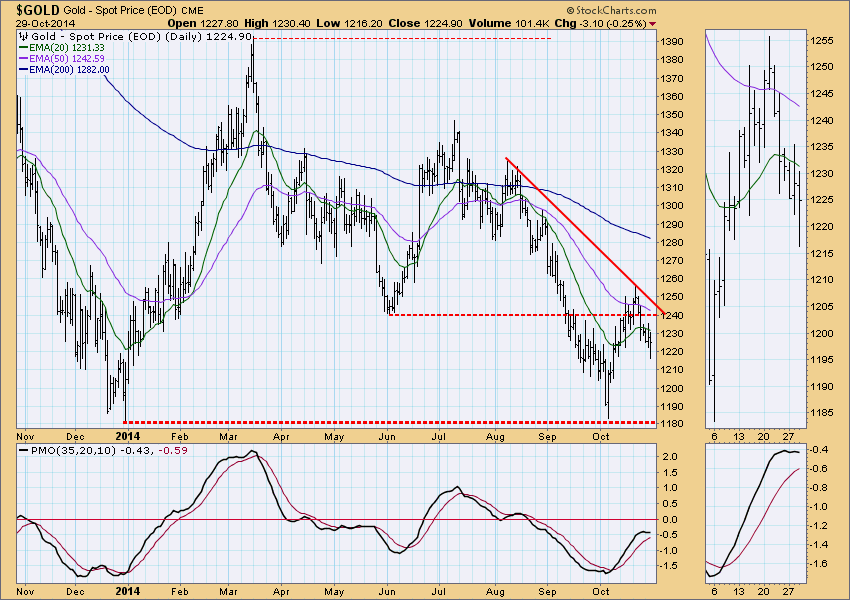
GOLD: As of 8/21/2014 Gold is on a Trend Model SELL signal. The LT Trend Model, which informs our long-term outlook, is on a SELL signal as of 2/15/2013, so our long-term posture is bearish.
It appears the PMO for Gold has topped below zero which is very bearish. A negative PMO crossover is nearing which would generate a PMO SELL signal. Unfortunately the closest area of support isn't until about 1180.
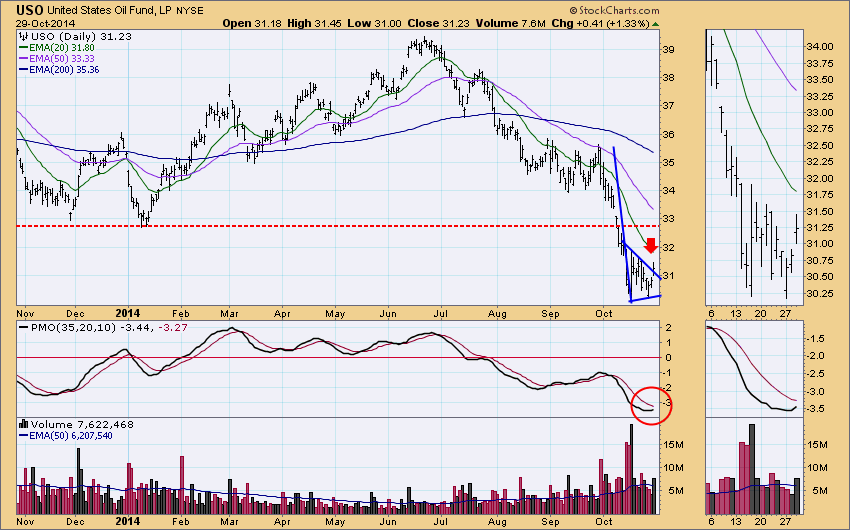
CRUDE OIL (USO): As of 7/30/2014 United States Oil Fund (USO) is on a Trend Model NEUTRAL signal. The LT Trend Model, which informs our long-term outlook, is on a SELL signal as of 8/28/2014, so our long-term posture is bearish.
It appears that USO is breaking out above the flag. It's very minor, but if this turns out to be a bullish conclusion to a bearish pattern, it would suggest the possibility of a new rally. The PMO has turned up in oversold territory which is bullish.
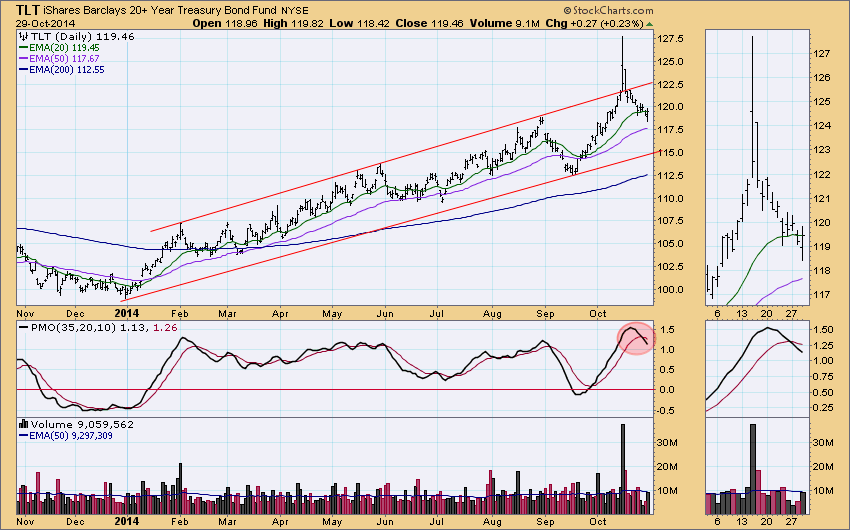
BONDS (TLT): As of 1/17/2014 The 20+ Year T-Bonds ETF (TLT) is on a Trend Model BUY signal. The LT Trend Model, which informs our long-term outlook, is on a BUY signal as of 3/24/2014, so our long-term posture is bullish.
Price is hovering around the 20-EMA, but it looks to be in a straight-forward correction so that support likely won't hold. The PMO had a negative crossover this week, generating a PMO SELL signal. TLT appears to be headed toward support at the bottom of the rising trend channel.
Technical Analysis is a windsock, not a crystal ball.
Happy Charting!
Erin


