 I don't like to toot my own horn, but Chip suggested I do today! Most of you are not aware that the DecisionPoint Trend Model signals have been tracked for many years by Timer Digest, a professional publication for market timers. In this monthly issue, I was listed as the #1 Bond Timer for the past 12 months. I thought it would be interesting to look at bonds, specifically TLT which we use to generate our signals. I'll also give you a quick review of the Trend Model and the signal changes that helped us get to the top for bond timing.
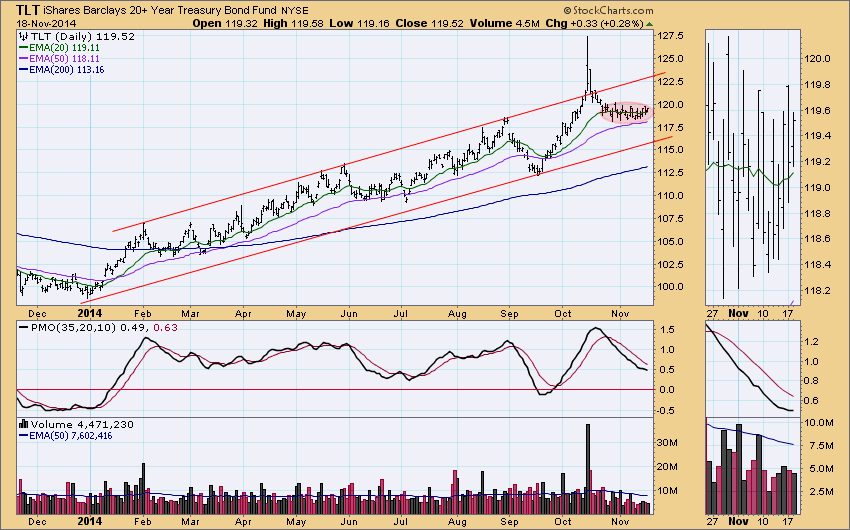
Bonds have been extraordinarily boring to follow for the past month as price has been traveling sideways, jogging up and down around its 20-EMA. The PMO has flattened with price so momentum is stagnating but not yet dying. The PMO is in somewhat overbought territory, so we'd like to see it move lower before a bottom. A move to the bottom of the rising trend channel would likely get the PMO back closer to zero.
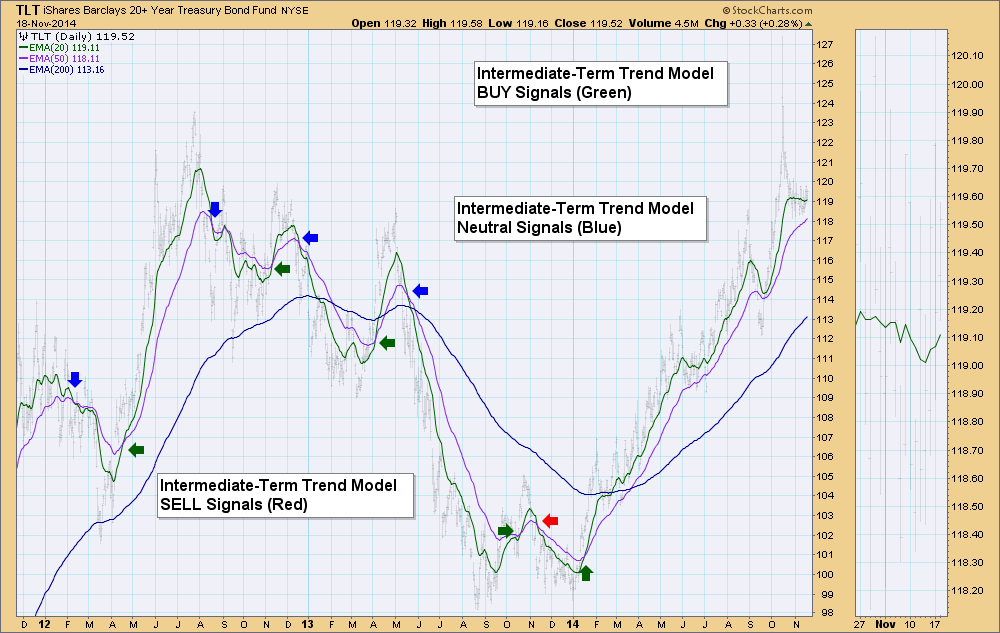
Here's a look at the Intermediate-Term Trend Model signal changes for the past three years. Whenever the 20-EMA crosses above the 50-EMA it is a BUY signal. I've annotated BUYs in green. The Neutral/SELL signals are slightly tricky, but DecisionPoint followers know that through study and practice, it becomes second nature. When the 20-EMA crosses below the 50-EMA either a Neutral or SELL signal is generated. If the 50-EMA is above the 200-EMA, it is a neutral signal. If the 50-EMA is below the 200-EMA, then the signal is a SELL. The basic idea behind this is determining whether the ETF (or stock or index, etc) is in a bull market or a bear market. When the 50-EMA is above the 200-EMA its a bull market and vice versa a bear market.
I'm flattered to be listed as #1 Bond Timer right now, but it isn't me that is being tested, it is our Trend Model. All of the signals I report to Timer Digest are generated mechanically using the methodology of the DecisionPoint Trend Model noted above. For more information on the DecisionPoint Trend Model, check out the ChartSchool article on it.
Happy Charting!
Erin


