NOTE: The DP Weekly Update will be moving to Fridays. That way you'll get a review of the weekly charts as well as the regular commentary.
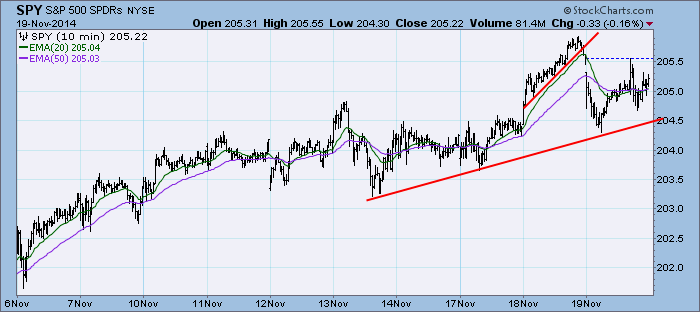
After breaking out yesterday, price broke down. The breakdown actually began at the end of yesterday where we noted that it could be problem. Fortunately, price landed safely on support and rebounded to recoup the morning's losses, but it appears yesterday's close is an area of ultra-short-term resistance.
The purpose of the DecisionPoint Daily Update is to quickly review the day's action, internal condition, and Trend Model status of the broad market (S&P 500), the nine SPDR Sectors, the U.S. Dollar, Gold, Crude Oil, and Bonds. To ensure that using this daily reference will be quick and painless, we are as brief as possible, and often we let a chart speak for itself.
SIGNALS: Here we include the current day's signal table, an excerpt from the DecisionPoint Alert Daily Report.
DECISIONPOINT ALERT DAILY REPORT
Wednesday, 11/19/2014

************************ DECISIONPOINT MARKET POSTURE ***********************

The following is the market posture suggested by our mechanical trend-
following tools. These are not trading recommendations, rather they are price
activity flags that should be qualified by chart analysis. The Trend Model is
used on all indexes.


                                     Days   Index     11/19   Points  Percent
Index               Posture     Date Elap  @Start     Close      P/L      P/L
------------------- ------- -------- ---- -------   -------  -------  -------
Stocks Medium-Term  Bullish 10/31/14   19   201.66   205.22    +3.56    +1.8%
Stocks Long-Term    Bullish 10/31/14   19   201.66   205.22    +3.56    +1.8%
Gold (NY Spot)      Bearish 08/21/14   90  1275.40  1193.90   +81.50    +6.4%
20+Yr T-Bond  (TLT) Bullish 01/17/14  306   102.88   118.76   +15.88   +15.4%
------------------- ------- -------- ---- -------   -------  -------  -------
Dollar Index  (UUP) Bullish 07/21/14  121    21.47    23.30    +1.83    +8.5%
Commodities   (GSG) Neutral 07/14/14  128    32.64    26.42     ....     ....
Crude Oil     (USO) Neutral 07/30/14  112    36.92    28.25     ....     ....
------------------- ------- -------- ---- -------   -------  -------  -------
S&P 500       (SPY)     BUY 10/31/14   19   201.66   205.22    +3.56    +1.8%
S&P Equal Wt  (RSP)     BUY 11/03/14   16    78.10    79.32    +1.22    +1.6%
Dow           (DIA)     BUY 10/31/14   19   173.45   176.93    +3.48    +2.0%
Nasdaq 100    (QQQ)     BUY 10/29/14   21    99.81   103.20    +3.39    +3.4%
NDX Equal Wt (QQEW)     BUY 10/30/14   20    40.66    42.07    +1.41    +3.5%
S&P 100       (OEF)     BUY 10/31/14   19    89.75    91.28    +1.53    +1.7%
S&P 400 MidCp (IJH)     BUY 11/05/14   14   141.76   143.02    +1.26    +0.9%
S&P 600 SmlCp (IJR)     BUY 11/03/14   16   111.40   110.05    -1.35    -1.2%
Total Market  (VTI)     BUY 11/03/14   16   104.08   105.51    +1.43    +1.4%
Consumer Disc (XLY)     BUY 11/05/14   14    67.55    69.62    +2.07    +3.1%
Cons Disc EWt (RCD)     BUY 11/03/14   16    82.86    84.97    +2.11    +2.5%
Consumer Stpl (XLP)     BUY 08/20/14   91    44.59    48.46    +3.87    +8.7%
Cons Stpl EWt (RHS)     BUY 10/21/14   29    98.15   104.15    +6.00    +6.1%
Energy        (XLE) Neutral 09/08/14   72    95.08    86.28     ....     ....
Energy EWt    (RYE) Neutral 09/08/14   72    87.04    76.32     ....     ....
Financial     (XLF)     BUY 10/29/14   21    23.44    24.09    +0.65    +2.8%
Financial EWt (RYF)     BUY 10/30/14   20    42.64    43.62    +0.98    +2.3%
Health Care   (XLV)     BUY 10/23/14   27    64.31    68.29    +3.98    +6.2%
Health Cr EWt (RYH)     BUY 05/09/14  194   115.95   139.79   +23.84   +20.6%
Industrial    (XLI)     BUY 10/30/14   20    54.67    56.48    +1.81    +3.3%
Industrl EWt  (RGI)     BUY 10/31/14   19    87.96    89.65    +1.69    +1.9%
Materials     (XLB)     BUY 11/18/14    1    49.87    49.80    -0.07    -0.1%
Materials EWt (RTM)     BUY 11/17/14    2    84.00    84.83    +0.83    +1.0%
Technology    (XLK)     BUY 10/31/14   19    40.54    41.40    +0.86    +2.1%
Technolgy EWt (RYT)     BUY 11/04/14   15    87.51    88.76    +1.25    +1.4%
Utilities     (XLU)     BUY 08/28/14   83    42.62    45.62    +3.00    +7.0%
Utilities EWt (RYU)     BUY 08/20/14   91    71.92    76.94    +5.02    +7.0%

Average                                36                               +3.6%
NOTE: Mechanical trading model signals define the implied bias of the price index based upon moving average relationships, but they do not necessarily call for a specific action. They are information flags that should prompt chart review. Further, they do not call for continuous buying or selling during the life of the signal. For example, a BUY signal will probably return the best results if action is taken soon after the signal is generated. Additional opportunities for buying may be found as price zigzags higher, but the trader must look for optimum entry points. Conversely, exit points to preserve gains (or minimize losses) may be evident before the model mechanically closes the signal.
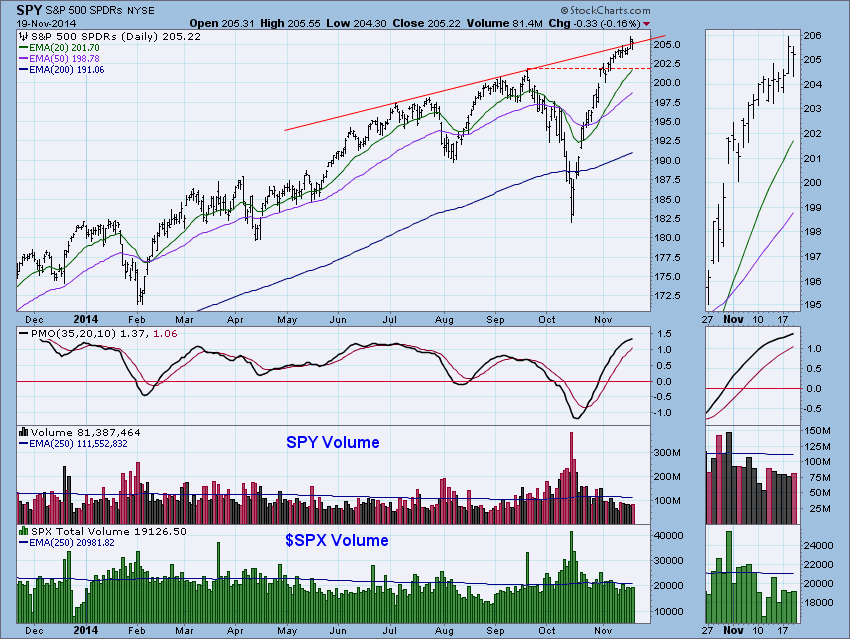
STOCKS: Based upon a 10/31/2014 Trend Model BUY signal, our current intermediate-term market posture for the S&P 500 (SPY) is bullish. The Trend Model, which informs our long-term outlook, is on a BUY signal as of 10/31/2014 so our long-term posture is bullish.
While price did decline today, it still managed to close just above resistance. The PMO keeps threatening to top in overbought territory. Volume was just below average. I suspect it will get thinner as we start moving into Thanksgiving week.
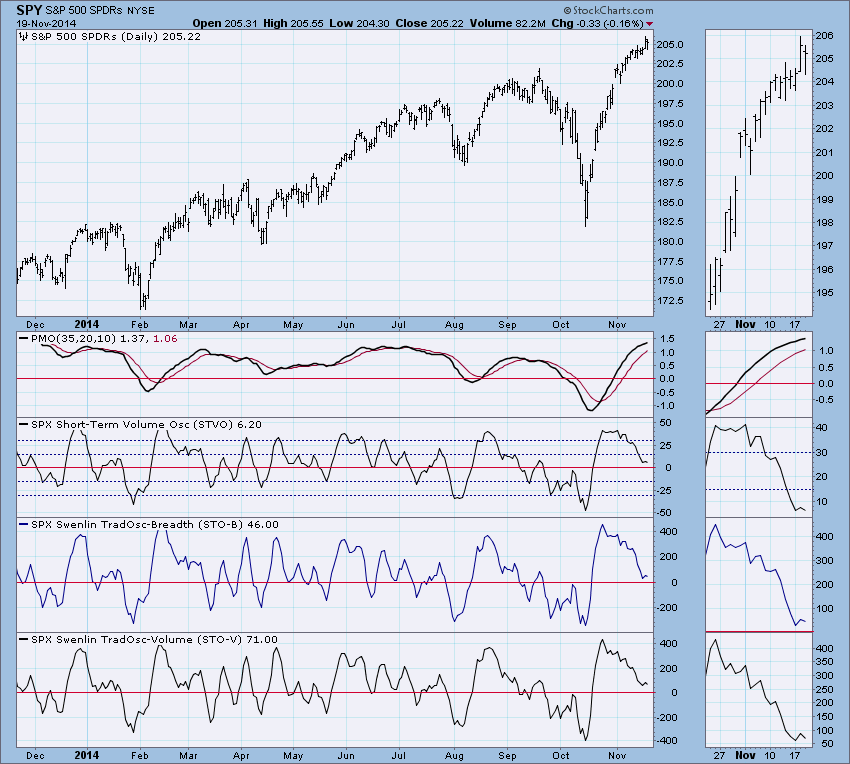
Ultra-Short-Term Indicators: Nothing remarkable so I would classify them as neutral.
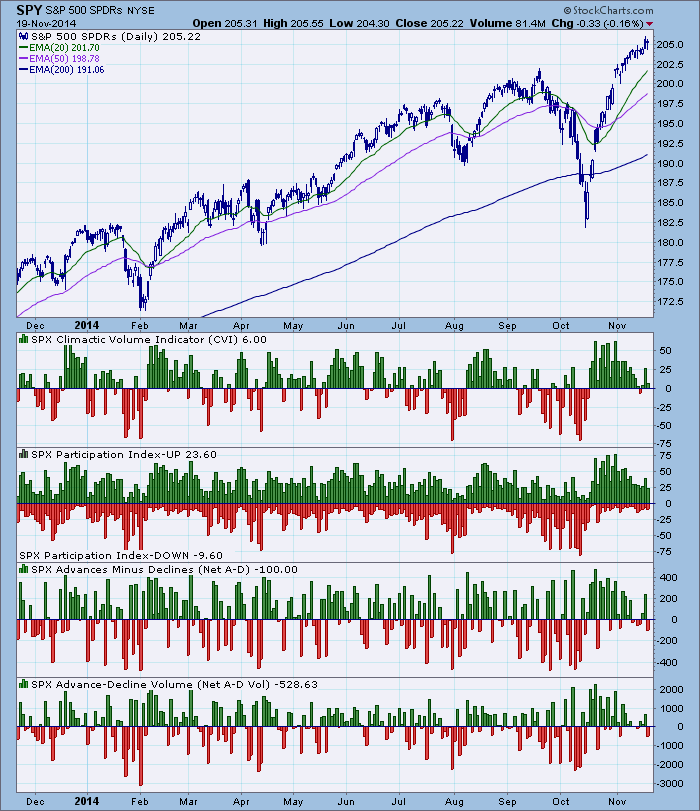
Short-Term Indicators: All of these indicators had turned up yesterday, but today they all turned back down, staying within the declining trend.
Intermediate-Term Indicators: Yesterday, like the short-term indicators, the ITBM, ITVM and VTO all turned up but today they have all topped. This is bearish. If the ITBM and ITVM cross below their EMAs, which appears imminent, that would be extremely bearish.
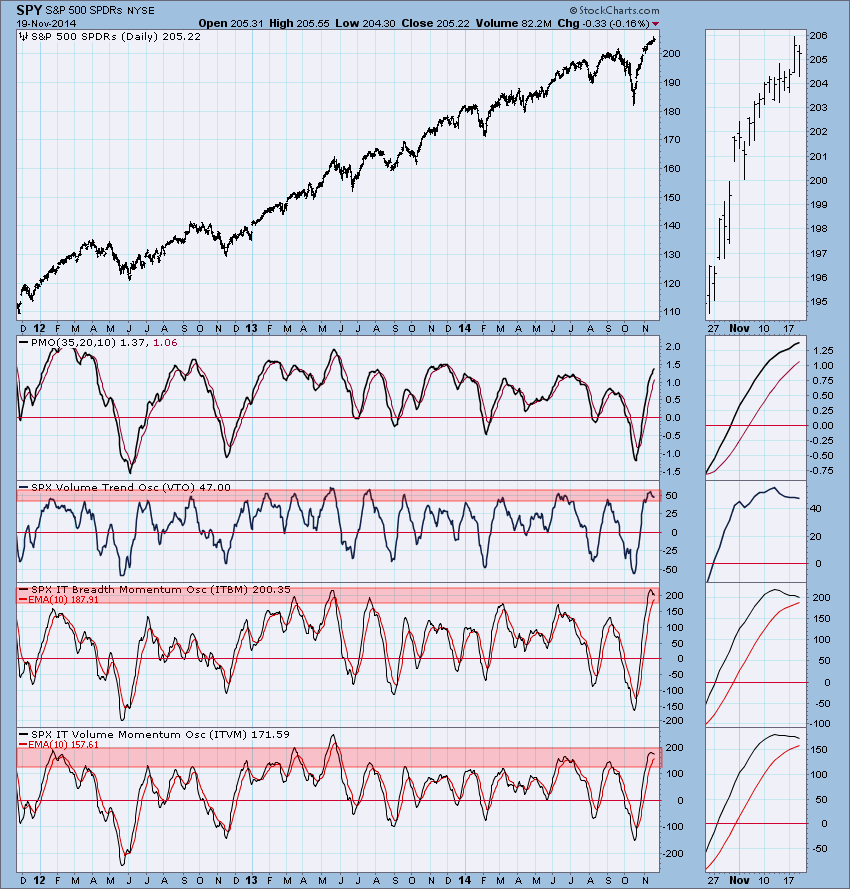
Conclusion: Let's face it, the market is completely overbought and a pullback or correction are needed and should be expected given the extremely overbought intermediate-term indicators. On the other hand, short-term indicators have been clearing overbought conditions on their own and are in neutral. My sense is that the market will plod along sideways or pullback somewhat over the next few more days and into the holiday. After that, things should get interesting.
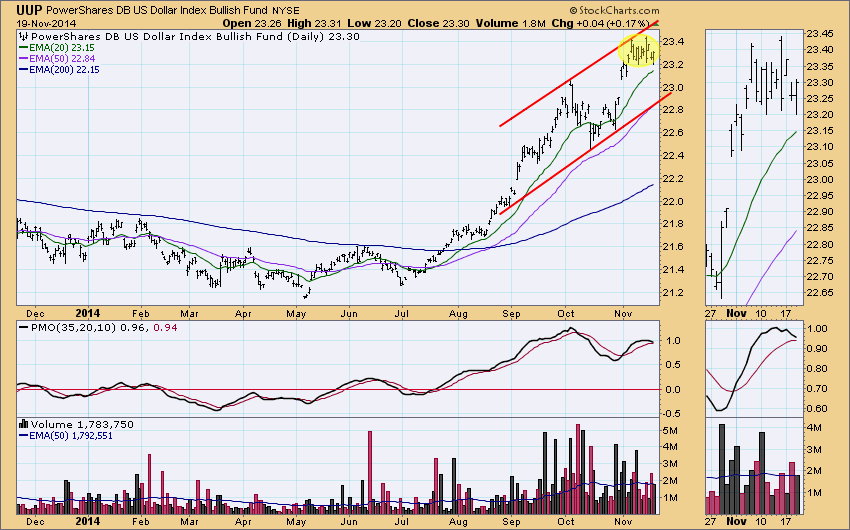
DOLLAR: As of 7/21/2014 the US Dollar Index ETF (UUP) is on a Trend Model BUY signal. The LT Trend Model, which informs our long-term outlook, is on a BUY signal as of 8/21/2014, so our long-term posture is bullish.
The dollar is in a consolidation pattern, however, the PMO has nearly reached its 10-EMA. Once it crosses below that will generate a PMO SELL signal.
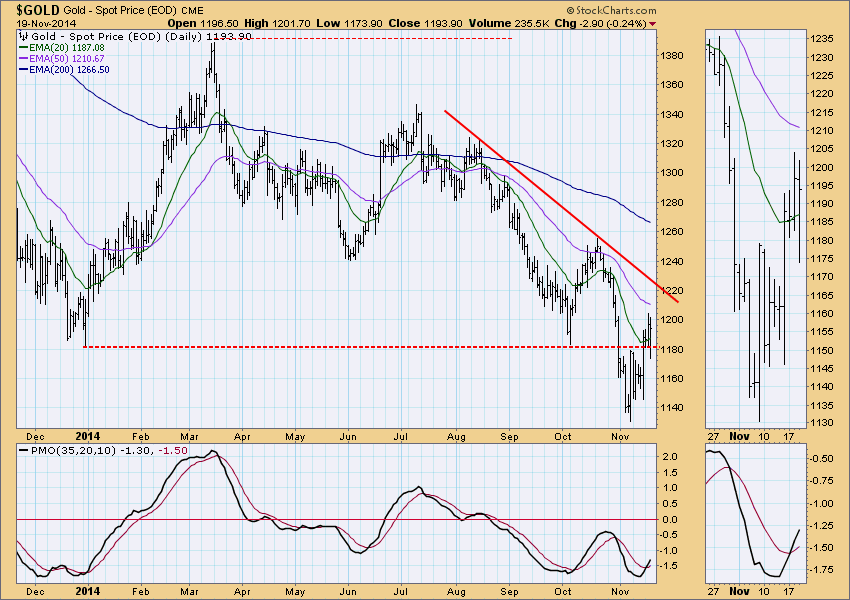
GOLD: As of 8/21/2014 Gold is on a Trend Model SELL signal. The LT Trend Model, which informs our long-term outlook, is on a SELL signal as of 2/15/2013, so our long-term posture is bearish.
The daily trading range for gold has been wide. Good news is that it is closing above the 20-EMA and the PMO yesterday generated a PMO BUY signal as it crossed above its 10-EMA. Gold is still in a very negative trend, so while things are looking up, I don't think this is a great entry point.
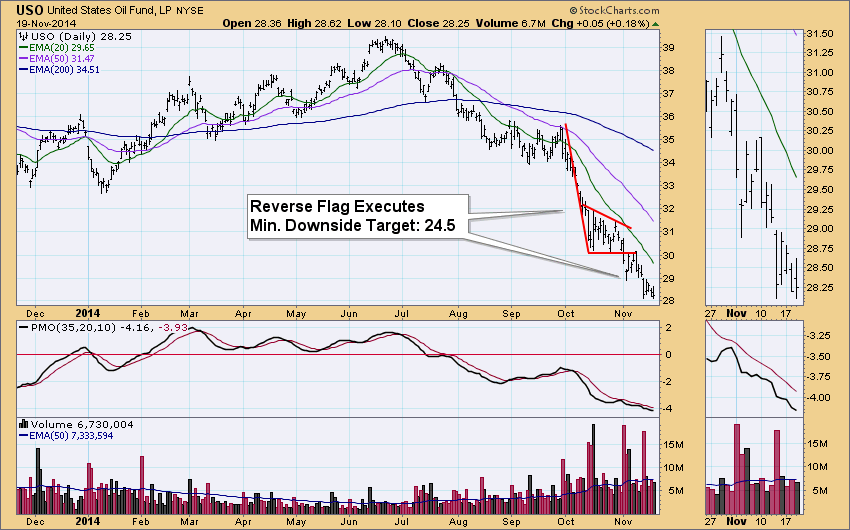
CRUDE OIL (USO): As of 7/30/2014 United States Oil Fund (USO) is on a Trend Model NEUTRAL signal. The LT Trend Model, which informs our long-term outlook, is on a SELL signal as of 8/28/2014, so our long-term posture is bearish.
We are still expecting more decline on USO after the reverse flag formation executed. He seems to be dragging its feet, but ultimately momentum is negative. At this point, I wouldn't look for a price bottom until the PMO has a positive crossover its EMA.
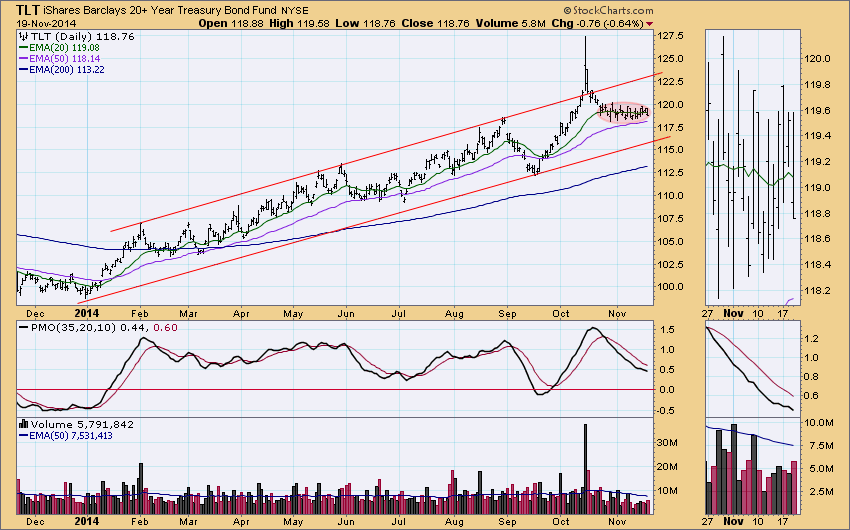
BONDS (TLT): As of 1/17/2014 The 20+ Year T-Bonds ETF (TLT) is on a Trend Model BUY signal. The LT Trend Model, which informs our long-term outlook, is on a BUY signal as of 3/24/2014, so our long-term posture is bullish.
The consolidation continues.
Technical Analysis is a windsock, not a crystal ball.
Happy Charting!
- Erin


