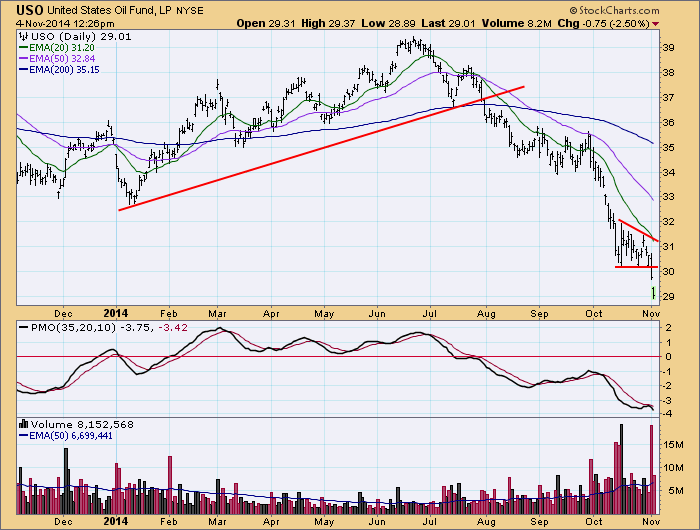
Crude oil has dropped below $80.00 and is currently trading at about $76.50. We use the U.S. Oil Fund ETF (USO) as a surrogate for crude because it incorporates the cost of trading the futures contracts, and provides a simple vehicle for trading crude.
At the end of July USO broke an important rising trend line (the line is much longer than can be displayed on the one-year daily bar chart). In October USO found short-term support just above $30.00, but the development of a descending triangle during the October pause implied that lower prices were probably on the way. On Monday short-term support was broken, and the decline continued. A particularly bearish sign is that the PMO has topped below its EMA.
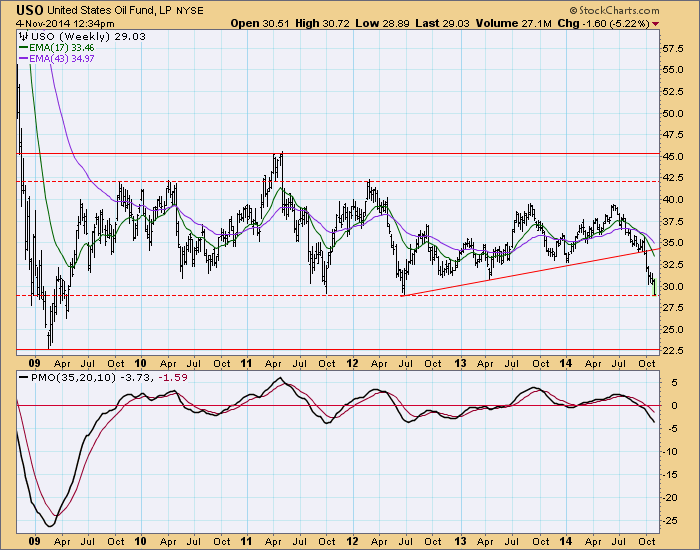
The weekly chart, as usual, puts short-term price movement in a more understandable context. Not only can we can see the relative importance of the violation of the two-year rising trend line, but we can also see that price has reached a critical line of support at about $29.00, a line that has held twice before in 2011 and 2012. While the line may indeed stop the decline, there is no indication in the short-term that the decline is over.
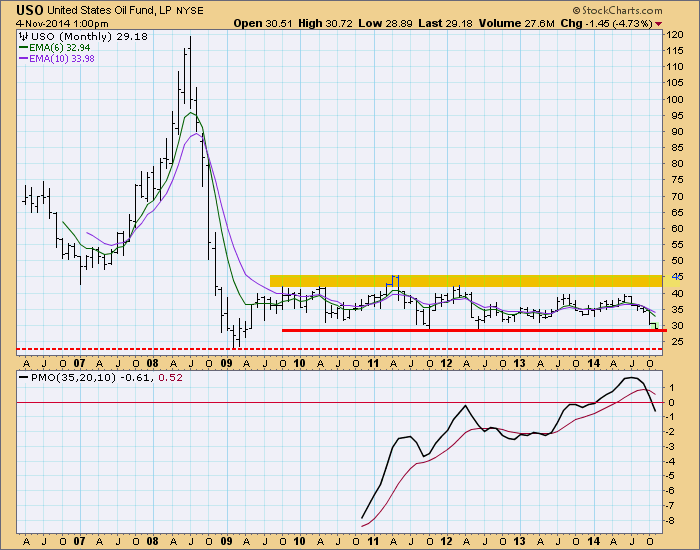
The longest-term support is at the 2009 low (about $22.50), which marked the bottom of the parabolic collapse.
Let us conclude by savoring this textbook example of how parabolic rises frequently resolve. Parabolic rises are bubbles, pure and simple. The vertical rise is followed by a collapse, which is then followed by a basing pattern that can last for years.
Conclusion: USO has reached important support, which may encourage price to bounce, but longer-term we will look for the basing pattern to prevail indefinitely.


