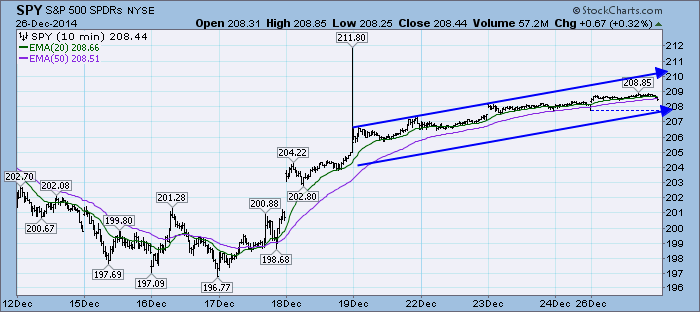
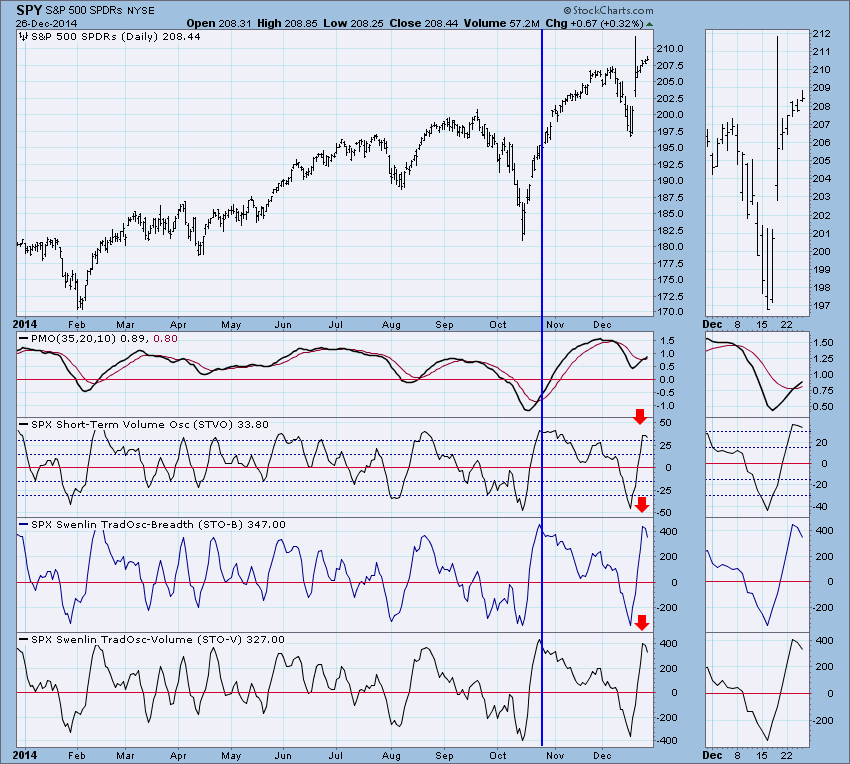
In general, price has been consolidating in a slightly elevated trend. The holiday week has been uneventful as far as market action, although we did see a Price Momentum Oscillator (PMO) crossover on the SPY.
The purpose of the DecisionPoint Daily Update is to quickly review the day's action, internal condition, and Trend Model status of the broad market (S&P 500), the nine SPDR Sectors, the U.S. Dollar, Gold, Crude Oil, and Bonds. To ensure that using this daily reference will be quick and painless, we are as brief as possible, and often we let a chart speak for itself.
SIGNALS: Here we include the current day's signal table, an excerpt from the DecisionPoint Alert Daily Report.
DECISIONPOINT ALERT DAILY REPORT
Friday, 12/26/2014

************************ DECISIONPOINT MARKET POSTURE ***********************

The following is the market posture suggested by our mechanical trend-
following tools. These are not trading recommendations, rather they are price
activity flags that should be qualified by chart analysis. The Trend Model is
used on all indexes.


                                     Days   Index     12/26   Points  Percent
Index               Posture     Date Elap  @Start     Close      P/L      P/L
------------------- ------- -------- ---- -------   -------  -------  -------
Stocks Medium-Term  Bullish 10/31/14   56   200.55   208.44    +7.89    +3.9%
Stocks Long-Term    Bullish 10/31/14   56   200.55   208.44    +7.89    +3.9%
Gold (NY Spot)      Bearish 08/21/14  127  1275.40  1195.30   +80.10    +6.3%
20+Yr T-Bond  (TLT) Bullish 01/17/14  343   102.43   124.41   +21.98   +21.5%
------------------- ------- -------- ---- -------   -------  -------  -------
Dollar Index  (UUP) Bullish 07/21/14  158    21.47    23.89    +2.42   +11.3%
Commodities   (GSG) Neutral 07/14/14  165    32.64    21.94     ....     ....
Crude Oil     (USO) Neutral 07/30/14  149    36.92    20.78     ....     ....
------------------- ------- -------- ---- -------   -------  -------  -------
S&P 500       (SPY)     BUY 10/31/14   56   200.55   208.44    +7.89    +3.9%
S&P Equal Wt  (RSP)     BUY 11/03/14   53    77.77    81.05    +3.28    +4.2%
Dow           (DIA)     BUY 10/31/14   56   172.64   180.19    +7.55    +4.4%
Nasdaq 100    (QQQ)     BUY 10/29/14   58    99.44   105.04    +5.60    +5.6%
NDX Equal Wt (QQEW)     BUY 10/30/14   57    40.66    43.36    +2.70    +6.6%
S&P 100       (OEF)     BUY 10/31/14   56    89.29    92.30    +3.01    +3.4%
S&P 400 MidCp (IJH)     BUY 11/05/14   51   141.11   146.25    +5.14    +3.6%
S&P 600 SmlCp (IJR)     BUY 11/03/14   53   110.95   114.72    +3.77    +3.4%
Total Market  (VTI)     BUY 11/03/14   53   103.53   107.36    +3.83    +3.7%
Consumer Disc (XLY)     BUY 11/05/14   51    67.27    72.23    +4.96    +7.4%
Cons Disc EWt (RCD)     BUY 11/03/14   53    82.65    88.47    +5.82    +7.0%
Consumer Stpl (XLP)     BUY 08/20/14  128    44.27    49.46    +5.19   +11.7%
Cons Stpl EWt (RHS)     BUY 10/21/14   66    97.79   106.27    +8.48    +8.7%
Energy        (XLE) Neutral 09/08/14  109    94.49    80.11     ....     ....
Energy EWt    (RYE) Neutral 09/08/14  109    86.56    68.48     ....     ....
Financial     (XLF)     BUY 10/29/14   58    23.32    24.95    +1.63    +7.0%
Financial EWt (RYF)     BUY 10/30/14   57    42.45    45.23    +2.78    +6.5%
Health Care   (XLV)     BUY 10/23/14   64    64.07    69.13    +5.06    +7.9%
Health Cr EWt (RYH)     BUY 05/09/14  231   115.84   144.20   +28.36   +24.5%
Industrial    (XLI)     BUY 10/30/14   57    54.37    57.40    +3.03    +5.6%
Industrl EWt  (RGI)     BUY 10/31/14   56    87.54    91.59    +4.05    +4.6%
Materials     (XLB)     BUY 12/26/14    0    49.23    49.23 * Changed Today *
Materials EWt (RTM)     BUY 12/22/14    4    83.94    84.93    +0.99    +1.2%
Technology    (XLK)     BUY 10/31/14   56    40.33    42.32    +1.99    +4.9%
Technolgy EWt (RYT)     BUY 11/04/14   52    87.04    92.66    +5.62    +6.5%
Utilities     (XLU)     BUY 08/28/14  120    42.24    48.55    +6.31   +14.9%
Utilities EWt (RYU)     BUY 08/20/14  128    71.41    80.79    +9.38   +13.1%

Average                                70                               +7.1%
NOTE: Mechanical trading model signals define the implied bias of the price index based upon moving average relationships, but they do not necessarily call for a specific action. They are information flags that should prompt chart review. Further, they do not call for continuous buying or selling during the life of the signal. For example, a BUY signal will probably return the best results if action is taken soon after the signal is generated. Additional opportunities for buying may be found as price zigzags higher, but the trader must look for optimum entry points. Conversely, exit points to preserve gains (or minimize losses) may be evident before the model mechanically closes the signal.
STOCKS: Based upon a 10/31/2014 Trend Model BUY signal, our current intermediate-term market posture for the S&P 500 (SPY) is bullish. The Trend Model, which informs our long-term outlook, is on a BUY signal as of 10/31/2014 so our long-term posture is bullish.
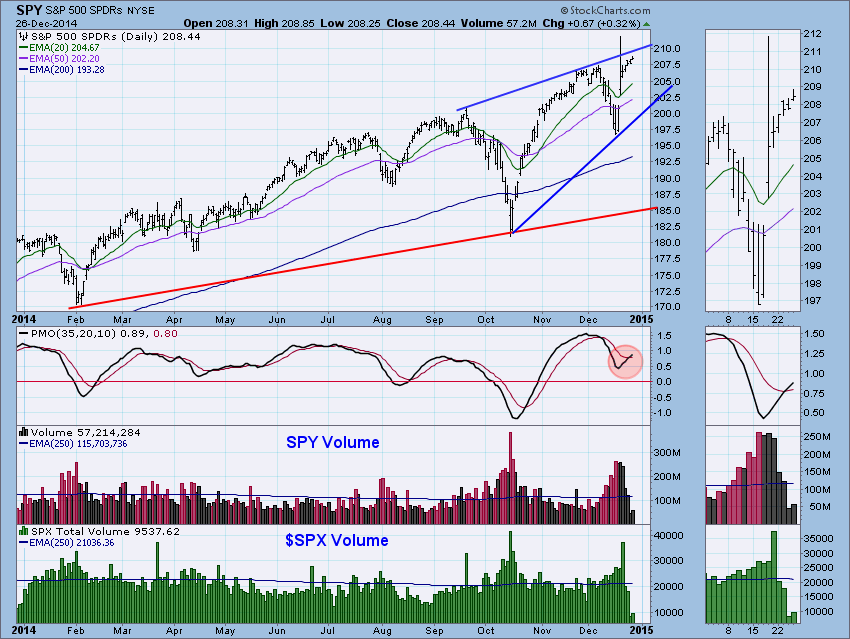
This week's most important PMO crossover occurred on the SPY. When the PMO crossed above its EMA it generated a PMO BUY signal. My concern right now is that overhead resistance is very close. The other concern is the bearish ascending wedge pattern. Looking at the indicators in all three time frames, we can determine whether these are valid concerns.
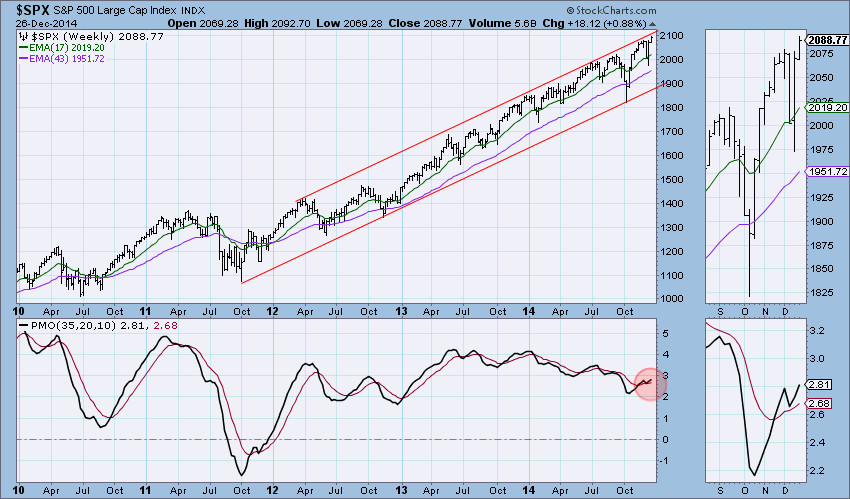
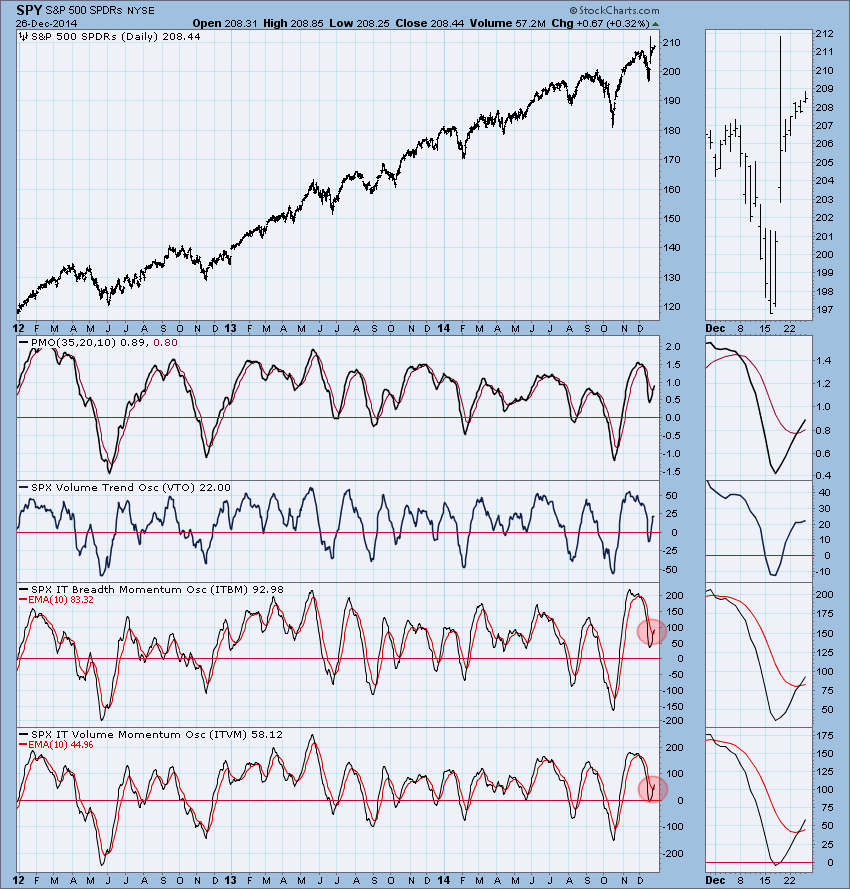
The weekly chart also shows price nearly hitting the top of a very long-term rising trend channel. On a positive note, the PMO is rising after bottoming before it broke down below its EMA.
Ultra-Short-Term Indicators: Readings are above average, but note that they have been declining which could foretell a price exhaustion.
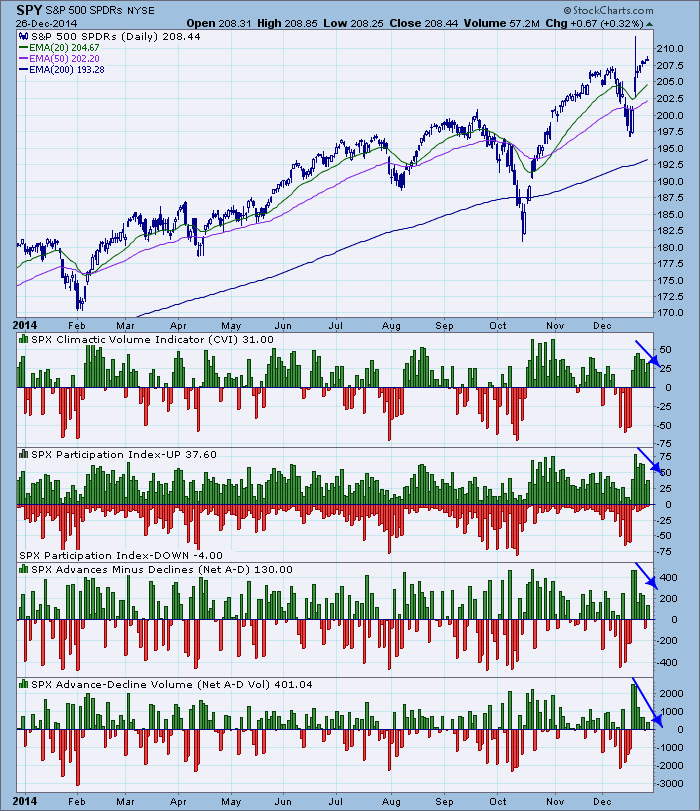
Short-Term Indicators: These indicators topped this week in very overbought territory and on a decline. This is bearish, but as I noted in Wednesday's blog, the last time we saw similarly shaped readings, it came in before the actual top.
Intermediate-Term Indicators: Intermediate term looks mostly bullish. The ITBM and ITVM have crossed above their EMAs and continue to rise. They are somewhat overbought which is not good, but they still have room to rise higher which is good.
Conclusion: Price has been gently rising for over a week. It seems likely we will see mostly similar market action through the end of December. After that I would be concerned. If price continues its slow rise, our indicators are going to get very overbought right around the beginning of January..
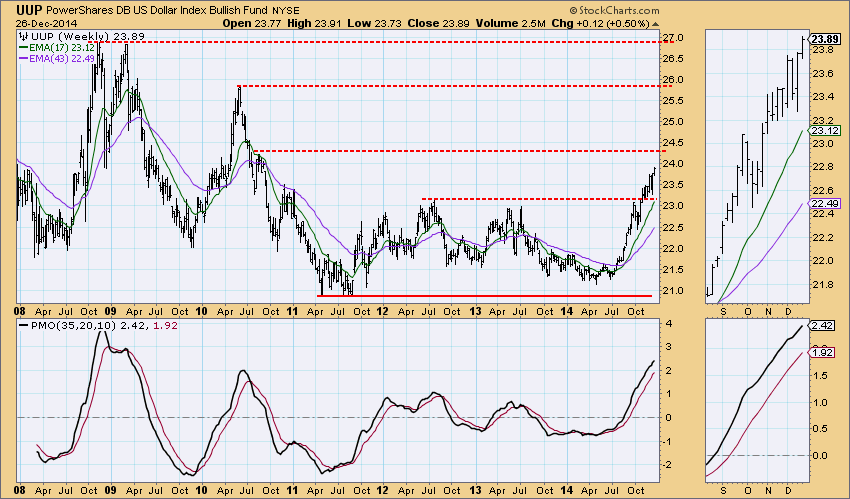
DOLLAR: As of 7/21/2014 the US Dollar Index ETF (UUP) is on a Trend Model BUY signal. The LT Trend Model, which informs our long-term outlook, is on a BUY signal as of 8/21/2014, so our long-term posture is bullish.
The dollar continues to rise. It has just about hit overhead resistance at a 3rd quarter 2011 top. The weekly PMO is rising strongly.
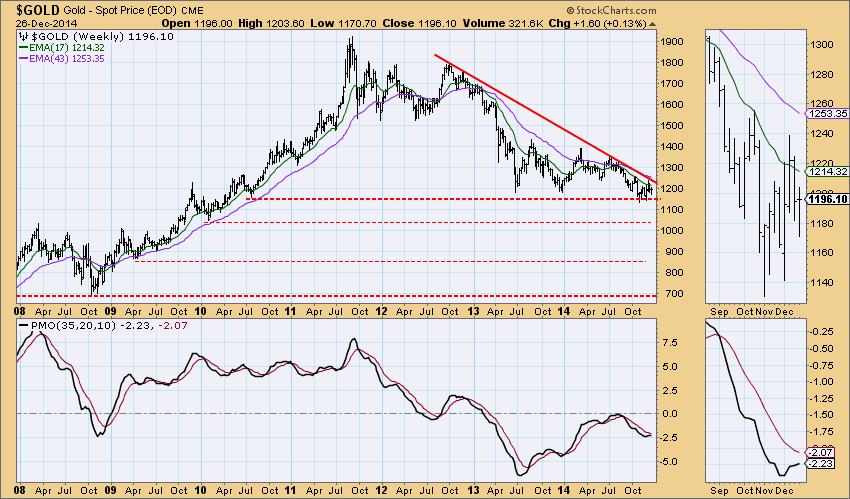
GOLD: As of 8/21/2014 Gold is on a Trend Model SELL signal. The LT Trend Model, which informs our long-term outlook, is on a SELL signal as of 2/15/2013, so our long-term posture is bearish.
Gold continues to confine itself in a bearish descending triangle. The expectation of this pattern is a breakdown. The weekly PMO is rising but appears to be struggling to do so which indicates momentum is running out.
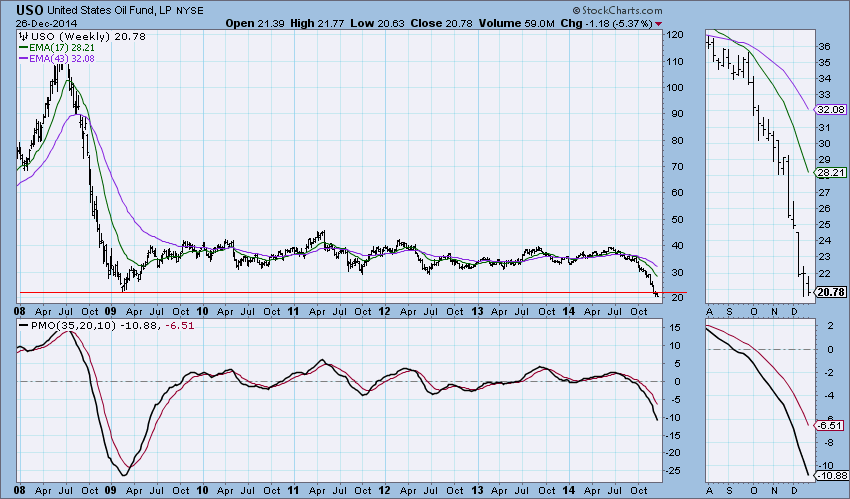
CRUDE OIL (USO): As of 7/30/2014 United States Oil Fund (USO) is on a Trend Model NEUTRAL signal. The LT Trend Model, which informs our long-term outlook, is on a SELL signal as of 8/28/2014, so our long-term posture is bearish.
Price is at an all-time low and it doesn't appear to be ready to turn it around yet. The PMO continues to accelerate downward past oversold territory. Nothing appealing here.
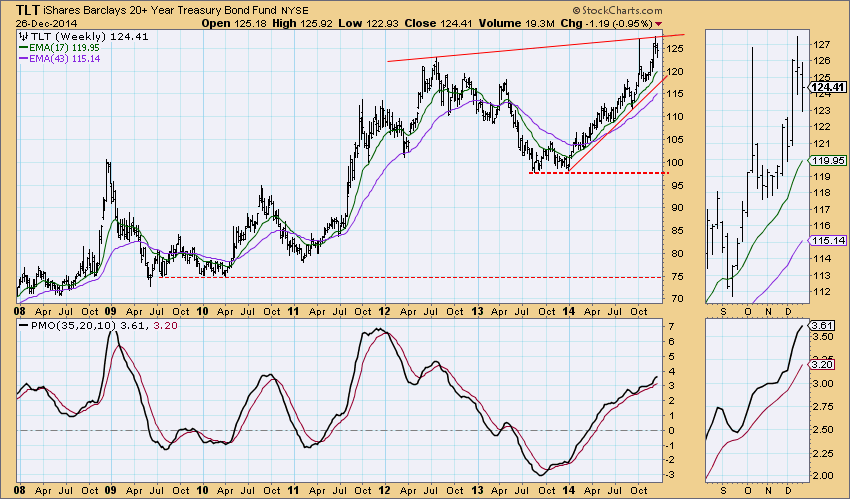
BONDS (TLT): As of 1/17/2014 The 20+ Year T-Bonds ETF (TLT) is on a Trend Model BUY signal. The LT Trend Model, which informs our long-term outlook, is on a BUY signal as of 3/24/2014, so our long-term posture is bullish.
Price bounced off of the ceiling of overhead resistance and is headed lower. Rising bottoms support is quite a few points below.
Technical Analysis is a windsock, not a crystal ball.
Happy Charting!
- Erin


